


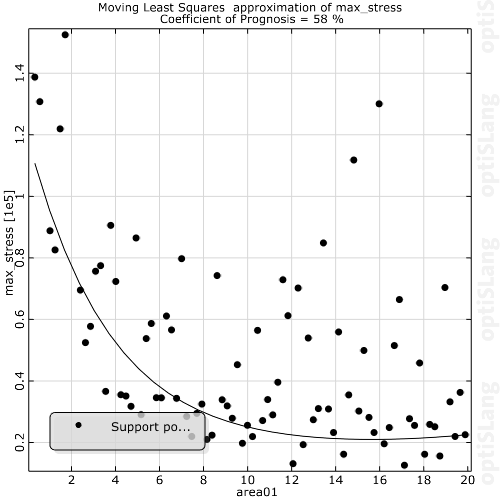
This plot shows the approximated values for the selected response or objective data function with regard to the first of the selected input parameter. In this plot, it is possible to select a support point (if visible). A selected support point can be deactivated or you can shift the visualized subspaces to the coordinates of this point. It is also possible to color selected designs according to the statistic postprocessing mode (see the context menu corresponding to the support point layer).
Support Point Layer Context Menu Options
The following options are available on the support point layer context menu:
| Context Menu Option | Description |
|---|---|
| Deactivate | Deactivate selected designs |
| Activate all | Activate all designs |
| Use current design values | Shift visualized subspace to the selected design |
| Style | Change color and/or symbol of selected designs |
Settings
| Option | Description |
|---|---|
| Common Settings | |
| Resolution | Sets the resolution of the distribution of the approximated line. |
| Show additional designs | Shows or hides additional designs not processed by the MOP. |
| Preferences | |
|
The following preference settings are available:
For more details, see Plot Preference Settings. | |