


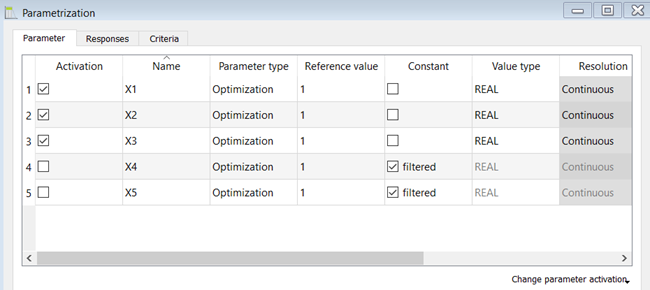
This plot provides a tabular overview of the defined parameters, the calculated responses and the specified criteria. Each group is shown in a separate tab.
On the Parameter tab, you can change the activation status from either the Change parameter activation drop-down list or by selecting and clearing the Activation check box for each parameter.
On the Responses tab, you can change the activation status by selecting and clearing the Activation check box for each response.
On the Criteria tab, you can modify, add and remove criteria. To change the activation status, select or clear the Activation check box for each criterion. After clicking , the newly specified criteria is calculated and can be shown in other plots.
Preferences
The following preference settings are available:
Window appearance
For more details, see Plot Preference Settings.
Python Scripting
Create Visual
Creates a Parametrization visual using data with data_id.
    parametrization = Visuals.Parametrization(
        Id("Parametrization"),
        data_id
    )
Add to Postprocessing
Adds Parametrization visual in postprocessing to control_container, using the specified relative positioning.
    control_container.add_control (
        parametrization,
        True,
        RELATIVE_POSITIONING,
        0., 0., 1., 1./2.
    )