


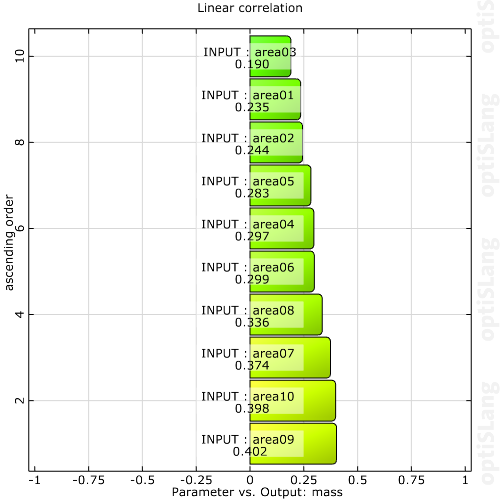
This plot shows the correlation coefficients of the selected input and output parameters respectively. The bar chart plot displays the correlation coefficients of all output parameters, if an input parameter is selected. The selected input parameter builds the underlying regression model. The selection of an output parameter leads to a sorted bar chart plot with correlation coefficients of single input parameter regression models for all input parameters.
Preferences
The following preference settings are available:
Choose X-Axis
Appearance
Font size
Line width
Enable axes
Axis Ranges
Labels
Palette
Window appearance
For more details, see Plot Preference Settings.
Python Scripting
Create Visual
Creates a linear correlation coefficients plot using data with data_id.
    lin_corr_coeff = Visuals.LinearCorrelationCoefficient(
        Id("Linear Correlation Coefficients"),
        data_id
    )
Add to Postprocessing
Adds linear correlation coefficients plot in postprocessing to control_container, using the specified relative positioning.
    control_container.add_control (
        lin_corr_coeff,
        True,
        RELATIVE_POSITIONING,
        0, 0, 1/2., 70/100.
    )