


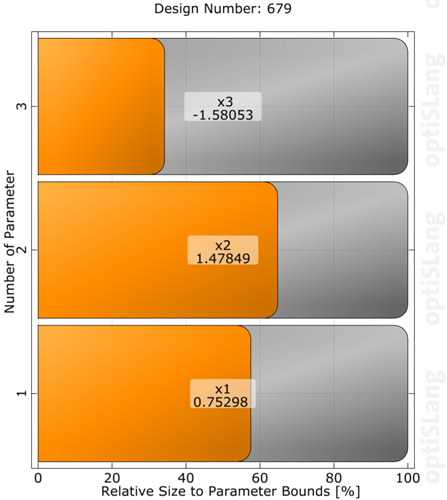
This bar chart plot shows the design input parameter values of the currently selected design relative to the parameter bounds. If you select an input parameter, its history will be shown in the History plot.
Preferences
The following preference settings are available:
Appearance)
Font size
Line width
Enable axes
Axis Ranges
Labels
Window appearance
For more details, see Plot Preference Settings.
Python Scripting
Create Visual
Creates Design Parameter plot using data with data_id.
    parameter_values = Visuals.ParameterValues(
        Id("Design Parameter"),
        data_id
    )
Add to Postprocessing
Adds Design Parameter plot in postprocessing to control_container, using the specified relative positioning.
    control_container.add_control (
        parameter_values,
        True,
        RELATIVE_POSITIONING,
        0., 0., 1., 1./2.
    )