


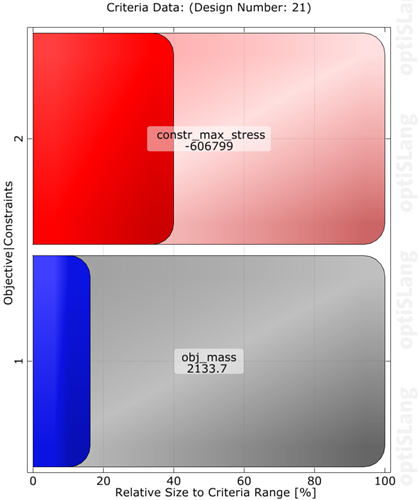
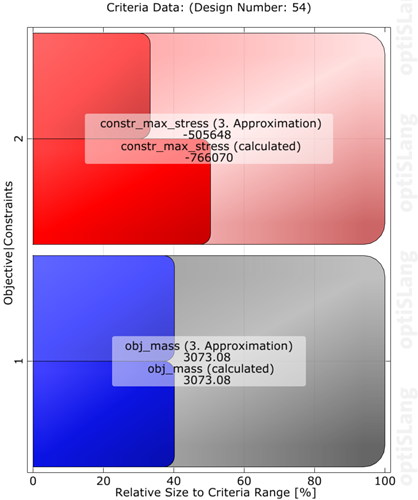
This bar chart plot displays the criteria data of the currently selected design relative to the minimum and maximum values. Just as the Response values plot, each value bar is divided into two sub-bars when approximated and validated designs are available. The lower bar shows the validated criterion data value and the upper bar shows the approximated value. A big gap is an indication of a bad approximation. If you select a criterion, its history will be shown in the History plot.
Preferences
The following preference settings are available:
Appearance
Font size
Line width
Enable axes
Axis Ranges
Labels
Window appearance
For more details, see Plot Preference Settings.
Python Scripting
Create Visual
Creates Criteria Data plot using data with data_id.
    criteria_values = Visuals.CriteriaValues(
        Id("Criteria Values"),
        data_id
    )
Add to Postprocessing
Adds Criteria Data plot in postprocessing to control_container, using the specified relative positioning.
    control_container.add_control (
        criteria_values,
        True,
        RELATIVE_POSITIONING,
        0., 0., 1., 1./2.
    )