


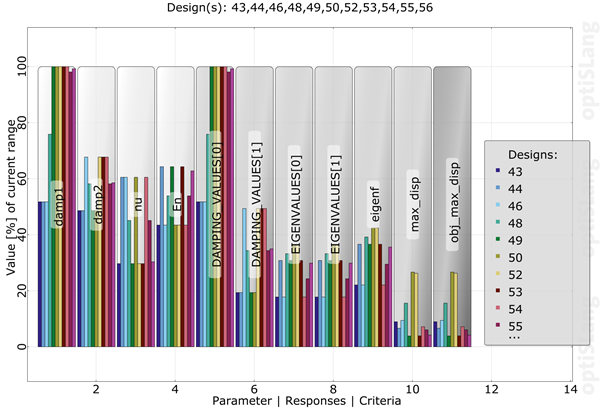
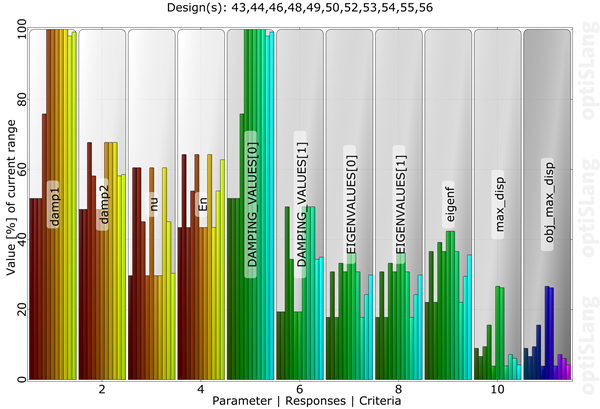
This plot is a bar chart for displaying and comparing multi-variable data of one or more quantitative dimensions.
Controls
| Control | Description |
|---|---|
| Left mouse button | Select single dimension |
| Right mouse button | Open context menu |
| Hold Shift + Left mouse button while dragging | Panning |
| Mouse wheel | Zoom the plot |
| Hold Ctrl + Mouse wheel | Adjust font size, line width and symbol size |
Context Menu
Using the context menu, the coloring mode can be switched between or by hovering over Change coloring and then clicking on the corresponding coloring mode. In the mode, each design has the same individual color across all dimensions in a dimension group. In this mode the legend is not available. In the mode, each design has the same individual color across all dimensions. This is the default coloring mode of the plot. When there are more then 12 designs, selected colors are repeated starting from the first color.
Preferences
The following preference settings are available:
Appearance
Font size
Line width
Enable axes
Axis Ranges
Labels
Window appearance
For more details, see Plot Preference Settings.