


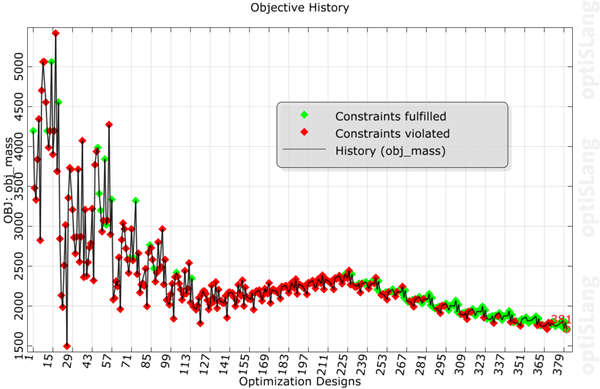
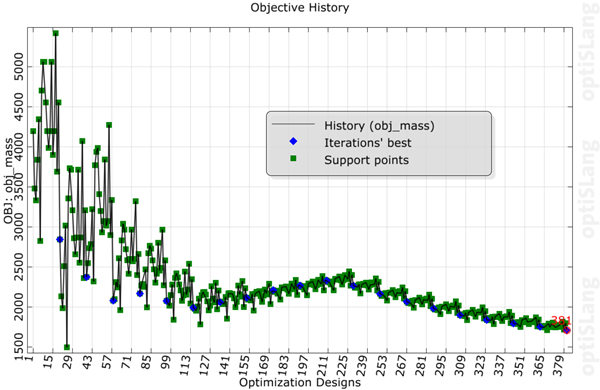
This plot displays arbitrary histories over all designs. The displayed history is selected on the bar chart plots. If it is an input parameter history, the lower and upper bounds of this parameter are also shown. To display the specific type of every design instead of the information about constraint violations, select the check box in the Custom settings pane. You can also select the current design for all bar chart plots.
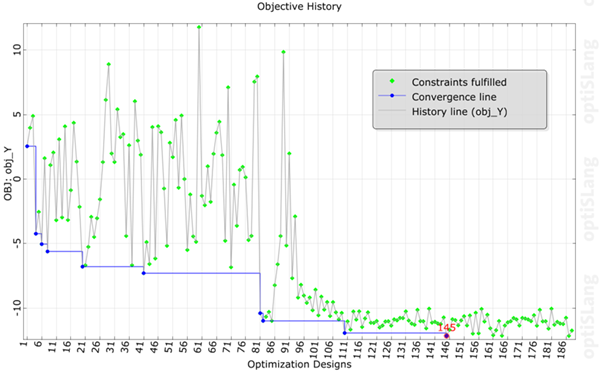
The Show convergence line setting is provided for single objective files of nature inspired optimization algorithms (NOA) and Simplex and Python based optimization algorithms such as the One-Click Optimization. It is selected by default when opening the optimization postprocessing, and shows the improvement of the algorithm over the evaluated feasible designs.
Settings
| Option | Description |
|---|---|
| Common Settings | |
| Show design types from algorithm | When selected, displays the specific type of every design. |
| Show convergence line | When selected, displays the improvement of the algorithm over the evaluated feasible designs. |
| Preferences | |
|
The following preference settings are available:
For more details, see Plot Preference Settings. | |
Python Scripting
Create Visual
Creates History plot using data with data_id.
history = Visuals.History(Id("History"), data_id)
Add to Postprocessing
Adds History plot in postprocessing to control_container, using the specified relative positioning.
    control_container.add_control (
        history,
        True,
        RELATIVE_POSITIONING,
        0., 0., 1., 1./2.
    )