


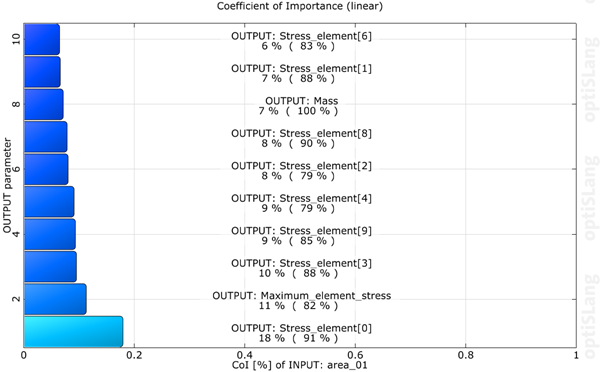
This plot shows the Coefficient of Importance (CoI) of the input parameters. If an input parameter is selected using the Correlation Matrices or the respective dimension selection controls, the bar chart plot displays the CoI of this parameter for all output parameters. The CoI for the full model with all input parameter is given in brackets behind the actual CoI value. If an output parameter is selected, the bar chart plot displays the CoIs of all parameters for this output parameter. The CoI of the full model (all input parameter terms) is written in the second title line. The information about the underlying model is written in the plot title.
Preferences
The following preference settings are available:
Choose X-Axis
Appearance
Font size
Line width
Enable axes
Axis Ranges
Labels
Palette
Window appearance
For more details, see Plot Preference Settings.
Python Scripting
Create Visual
Creates a CoI visual using data with data_id.
coi = Visuals.CoI(Id("Coefficient of Importance"), data_id)
Modify Visual
Adds an additional line to make the CoI change when a specific dimension field changes.
coi.ListenToDimensionIndex(0)
Add to Postprocessing
Adds the CoI visual in postprocessing to control_container, using the specified relative positioning.
    control_container.add_control
        (coi, True, RELATIVE_POSITIONING, 0, 70/100., 1/2., 30/100.)