


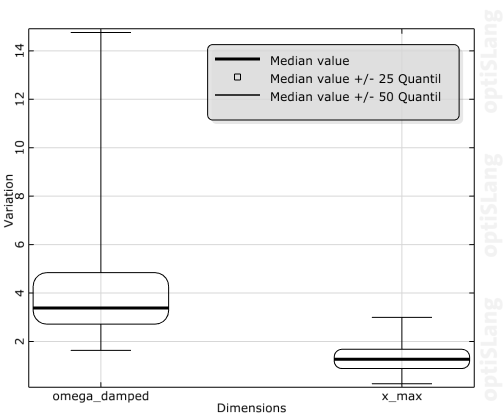
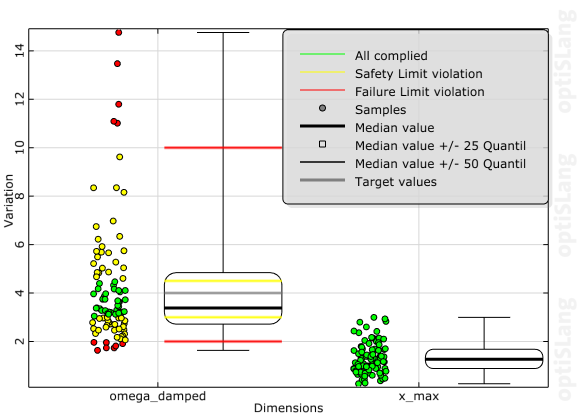
This plot is a method to depict the numerical data graphically through their quantiles. It consists of box, median-line and whisker-lines for each dimension of one group. The plot displays the variation in samples of a statistical population without making any assumptions of the underlying statistical distribution. The spacings between the different parts of the box indicate the degree of dispersion (spread) and skewness in the data. You can display samples and limits.
Settings
| Option | Description |
|---|---|
| Common Settings | |
| Group | Sets the group of dimensions to be viewed. |
| Scale to Min/Max | When selected, scales all content to the min/max values for each dimension separately so that all dimensions have a range of [0.0,1.0]. |
| Show box | Toggles the display of the box. When this check box is clear, and whiskers are enabled, the box is reduced to a crossed circle lying at median position. |
| Probability content | Defines size of the box, relative to the total probability content of data. For example, a value of 50 produces a box going from quantile 25 to quantile 75. Valid value range [0,100]. |
| Show whisker | Toggles the display of the whisker. |
| Probability content | Defines size of the whisker, relative to the total probability content of data. For example, a value of 100 produces whiskers going from quantile 0. to quantile 100. Valid value range [0,100]. |
| Show limits | When selected, displays limit lines when limits are set. |
| Show samples | When selected, displays sample points of each dimension to the left side of the plot. Sample points are plotted with a random variation in x-direction for a better view. If is selected, the samples are styled with limited color, otherwise with design style. |
| Preferences | |
|
The following preference settings are available:
For more details, see Plot Preference Settings. | |
Python Scripting
Create Visual
Creates a box whisker visual using data with data_id.
box_whisker = Visuals.BoxWhisker(Id(Visuals.BoxWhisker.get_display_name(), data_id)
Add to Postprocessing
Adds coefficient of importance visual in postprocessing to control_container, using the specified relative positioning.
    control_container.add_control
        (box_whisker, True, RELATIVE_POSITIONING, 0., 0., 1., 0.5)