


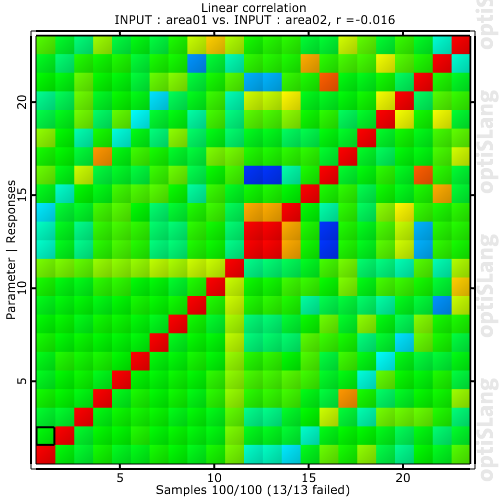
This plot displays linear correlation coefficients, histograms and anthill plots for all selected input and output parameters and their combinations respectively, combined into one plot. A selection in this plot alters the parameter selection globally in the postprocessing.
Settings
| Option | Description |
|---|---|
| Common Settings | |
| Histogram classes | Sets the value for the number of bars displayed in histograms when View as is not All correlations. |
| View as | Select one of the following options:
|
| Ranges | Select one of the following options:
|
| Preferences | |
|
The following preference settings are available:
For more details, see Plot Preference Settings. | |
Context Menu
| Option | Description |
|---|---|
| Appearance | Show/hide palette, choose font size or symbol size, enable/disable single bigger views by mouse overlay. |
| Display Groups | Displays parts of the matrix using the following options:
|
| Activate/Deactivate dimensions | Opens the Activate/Deactivate dimensions dialog where you can
show or hide one or more dimensions.
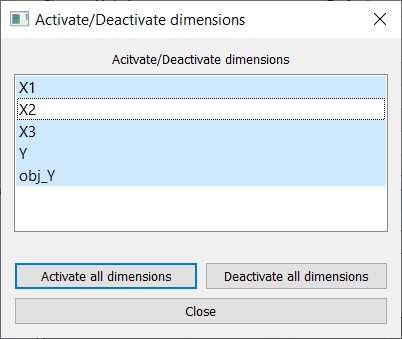
|
Python Scripting
Create Visual
Creates a Correlation Matrix using data with data_id.
    ext_corr = Visuals.ExtendedCorrelationMatrix(
        Id("Extended Correlation Matrix"),
        data_id
    )
Add to Postprocessing
Adds Correlation Matrix in postprocessing to control_container, using the specified relative positioning.
    control_container.add_control (
        ext_corr,
        True,
        RELATIVE_POSITIONING,
        0, 70/100., 1/2., 30/100.
    )