This multi-part tutorial shows how to export a field-MOP as an FMU (Functional Mock-up Unit) and import it into optiSLang, where you can then perform a sensitivity analysis:
This topic shows how to export a field-MOP with custom evaluation macros as an FMU. You can use the FMU to automate field-MOP evaluation and analyze the FMU using external tools. The list of software supporting FMUs includes Ansys Electronics Desktop with Twin Builder and the Python module FMPy.
To export a field-MOP as an FMU:
Start oSP3D.
In the Welcome to Statistics on Structures window, select Load an existing database and click .
Click the folder icon to select a file.
Navigate to
oSP3D_examples\ansys\circuit, select the oSP3D database file circuit_fmop.sdb, and click .This database file already contains field-MOPs generated from data imported from a DOE.
Click .
Select > > to start the FMU Export Wizard.
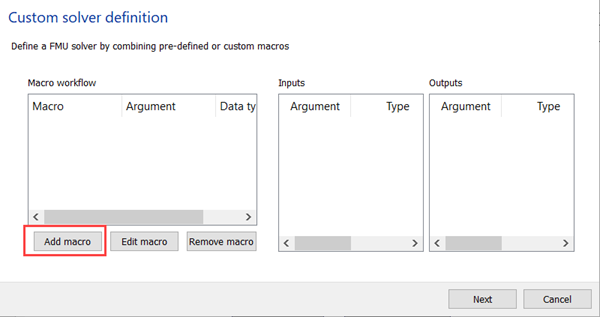
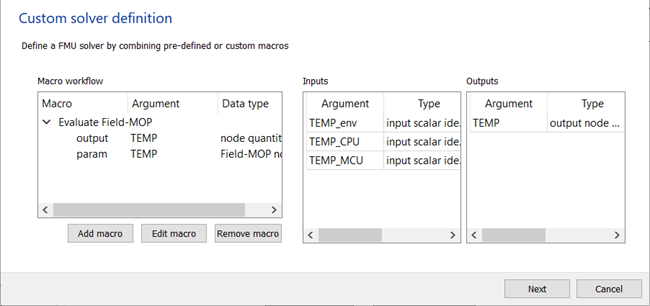
In the Custom solver definition window, click .
Select Evaluate Field-MOP
nodeEvaluateFieldMOP.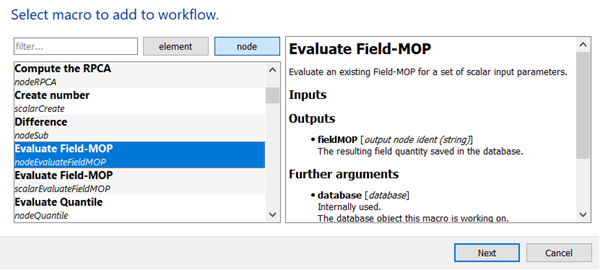
Click .
In the fieldMOP field, enter
TEMP.From the fmopIdent list, select .
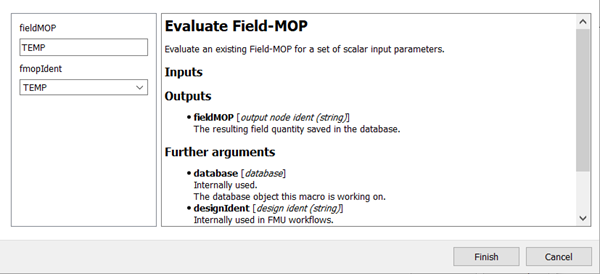
Click .
The macro is added to the custom solver definition.
Click .
Select Maximum value of a field.
Click .
In the nodeIdent field, enter
TEMP.From the Named selection list, select .
In the scalarMax field, enter
max[TEMP].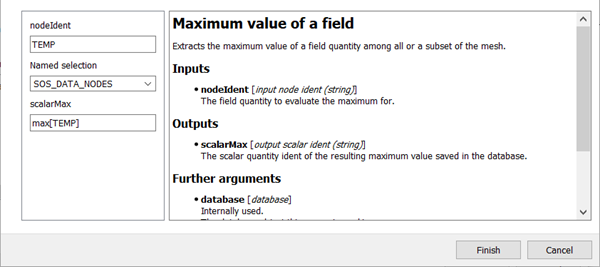
Click .
The macro is added to the custom solver definition.
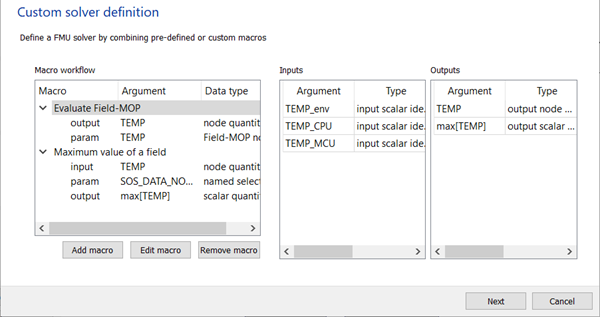
Click .
Click the folder icon.
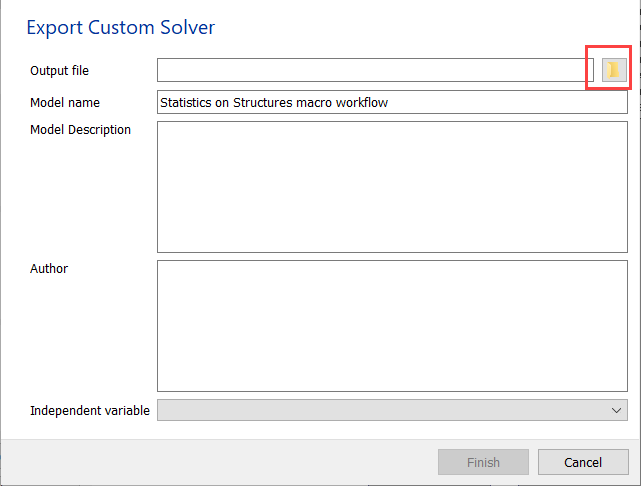
Select a file name, type, and location for your exported FMU file.
Click .
The file path is added to the Output file field.
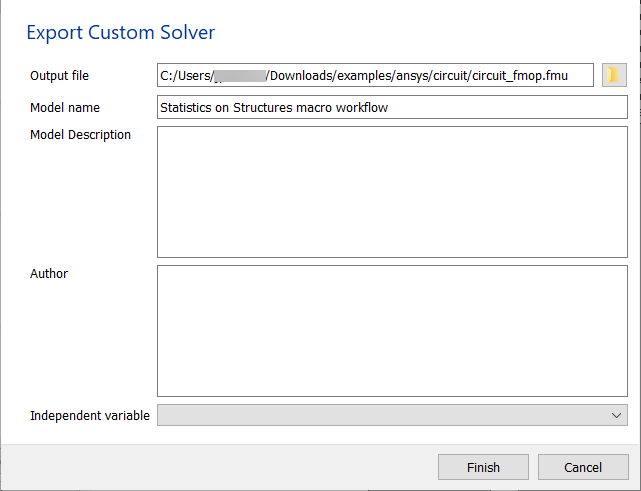
Click .
You can now import the FMU into optiSLang using the FMU_oSL3D custom integration node.
To import the FMU into optiSLang using the FMU_oSL3D custom integration node:
Start optiSLang and add a Parametric System to your project.
While pressing the Shift key, drag and drop an FMU_oSL3D node onto the Parametric System.
Right-click the FMU_oSL3D node and select > .
Right-click the FMU_oSL3D node and select > .
Edit the FMU_oSL3D node and open the previously exported FMU file.
Add all inputs to the parameter list.
Add all outputs to the response list.
Click Show advanced options and set Designs per execution to a large number (such as 100000).
For the FMU's solver to run fast and store all result data in the output database, Designs per execution must be set to a large enough number that all designs are processed at once.
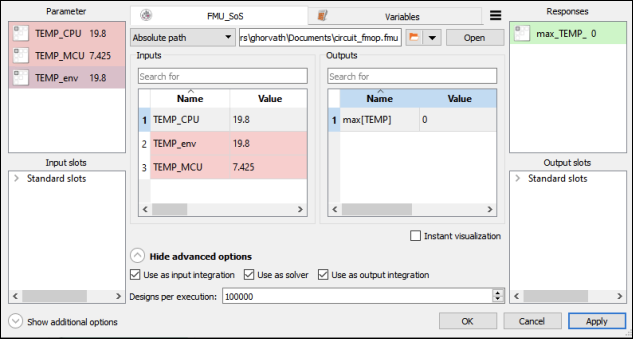
Click .
Run the project.
You can now perform a sensitivity analysis with the FMU.
To perform a sensitivity analysis with the FMU:
Drag and drop the Sensitivity Wizard onto the title bar of the Parametric System.
Check the input parameters and their ranges.
The correct ranges are provided by the FMU.
Click .
Check parameters and responses.
Because you are not performing optimization, click .
Set Sampling Method to Other (see next page) and click .
Set the number of samples to 200.
Click .
Clear the Create MOP check box and click .
Run the project.
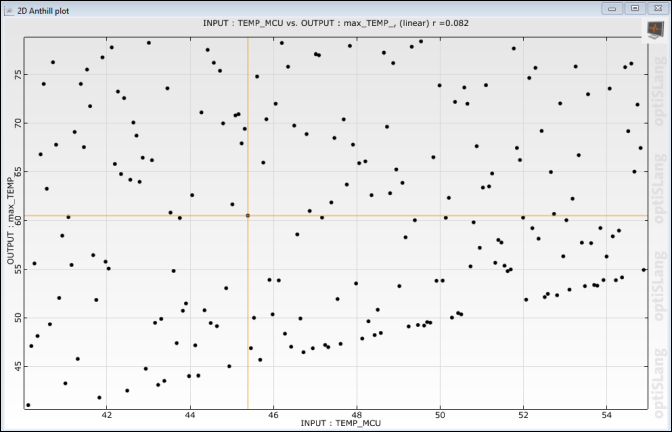
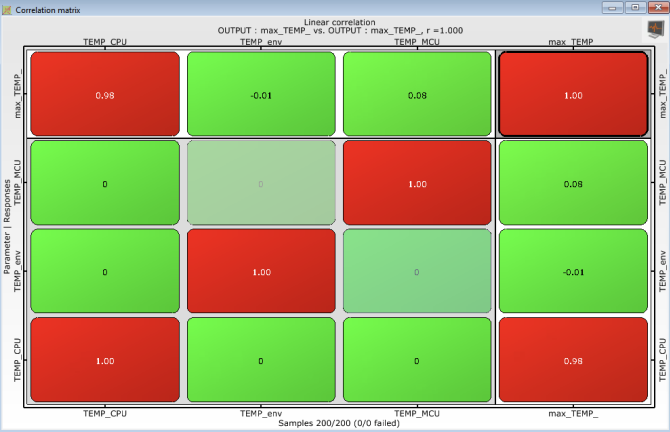
Once the project runs, postprocessing opens. Unsurprisingly, a correlation matrix of the results for the sensitivity analysis show that the CPU's temperature is the main driver of the maximum temperature on the entire circuit board. At higher CPU temperatures, there is a linear correlation between CPU temperature and maximum temperature. MCU temperature shows relevancy only at a low CPU temperature and high MCU temperature.
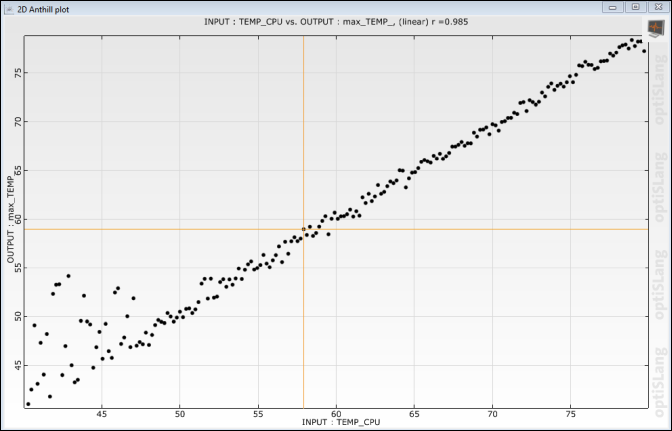
This image shows a plot of the CPU temperature input parameter versus the maximum temperature.
This next image shows a plot of the MCU temperature input parameter versus the maximum temperature.