For Time Based, Stress-Life Analysis (SN), the Static Failure Damage is set to 1.234e29 in the input.dcl file used by nCode solver.
SetProperty("SNEngine_Fatigue",StaticFailureDamage,"1.234E29")
If "Static Failure" is detected, Mechanical displays a warning message:
Calculated alternating stress in some areas exceeded the UTS, which indicates Static Failure. For those areas, Life is set to the Static Failure Life and Damage is set to the Static Failure Damage; plotted as purple contours.
The purple band in the legend, corresponding to the Static Failure Life or Static Failure Damage value, represents all the areas where Static Failure is reported.
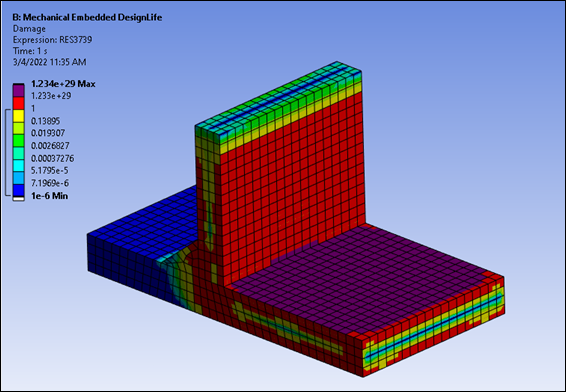
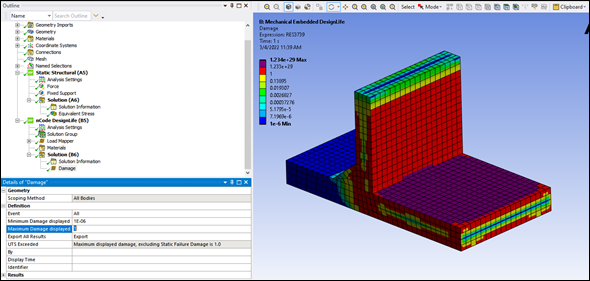
The next color band is represented by red. The value of the red band corresponds to the Maximum Damage Displayed (Case 1) or the maximum damage calculated (if it is less than the limit of the Maximum Damage Displayed (Case 2).
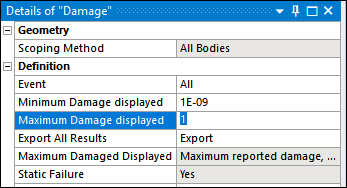
Case 1 — In the figure below, the Maximum Damaged Displayed is set to 1. However, the Maximum Damage calculated is of 977.1. Therefore, Mechanical issues the following warning message:
Calculated damage in some areas is above the specified maximum damage.
As you restricted the Maximum Damaged Displayed to 1, all values above were set to 1 and displayed in red.
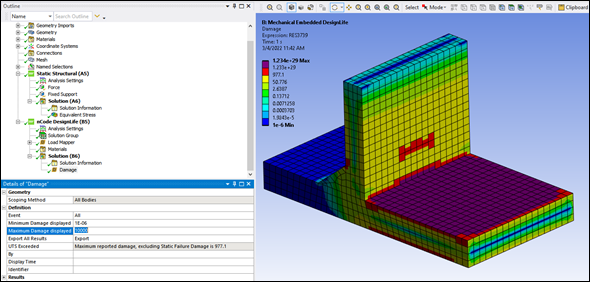
Case 2 — In the figure below, the Maximum Damage Displayed is set to 1e4. The warning message is no longer displayed, as the limit is not reached. The Maximum Damage Displayed was set to 1e4, while the maximum calculated is 977.1.
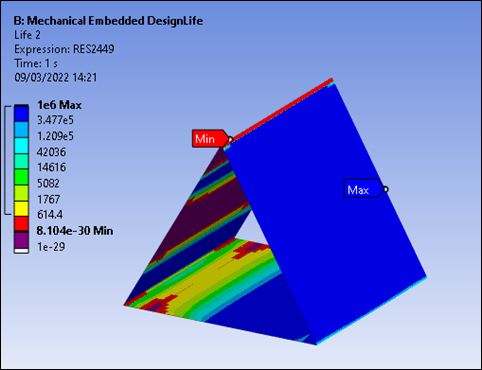
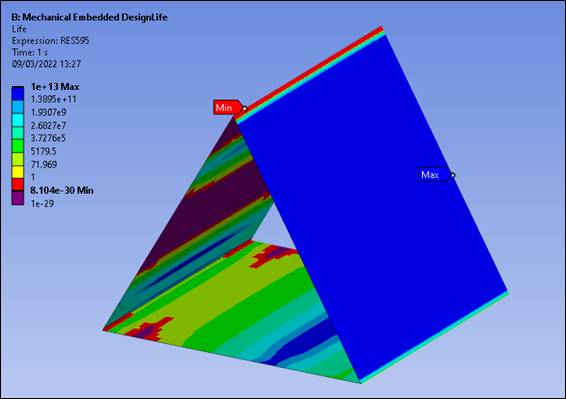
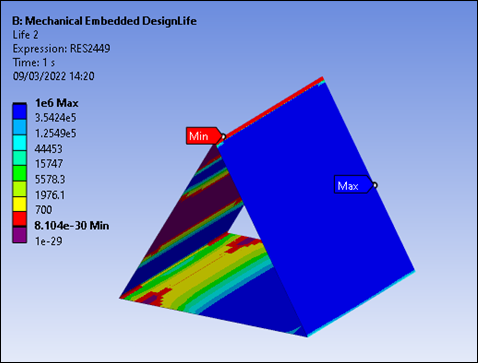
The next band color is represented by red. The value of the red band will correspond to the Minimum Life Displayed (Case 1) or the Minimum Life calculated (if it is higher than the limit of the Minimum Life Displayed (Case 2).
Case 1 — In the figure below, the Minimum Life Displayed is set to 700. However, the Minimum Life calculated is of 614.4. Therefore, Mechanical issues the following warning message:
Calculated life in some areas is below the specified minimum life.
As the user restricted the Minimum Life Displayed to 700, all values below were set to 700 and displayed in red.
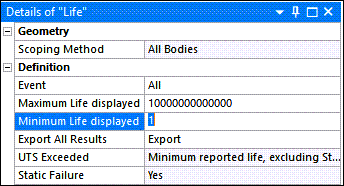
Case 2 - In the figure below, the Minimum Life Displayed is set to 1. The warning message is no longer displayed, as the limit is not reached. The Minimum Life Displayed was set to 1, while the maximum calculated is 614.4.