Point Clouds are often used to explicitly specify a series of locations where inquires to local CFD solutions can be made. They are mainly used by Monitor Probes of the type Wall Sampling or General Data Sampling (see Probes for Time-Averaged and Spatially Resolved Data). Use the Point Cloud Editor to define spatially resolved coordinates. It is accessed from either a Monitor Probe’s Point Cloud Selector or from the Libraries menu. Once the point coordinates are defined, the Point Cloud Editor displays the selected coordinates in the table and displays the selected points in the 3-D View.
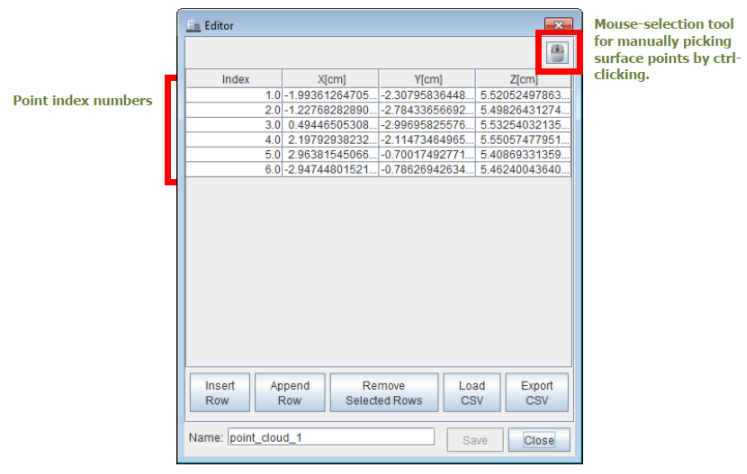
To select points with the mouse in the 3-D View, click the mouse
![]() icon in the upper-right corner of the Editor. Then, at each surface point
to be selected, ctrl-click. Once a point is picked, it will be marked in the 3-D View window and
its coordinates will automatically show in the table.
icon in the upper-right corner of the Editor. Then, at each surface point
to be selected, ctrl-click. Once a point is picked, it will be marked in the 3-D View window and
its coordinates will automatically show in the table.
Note: In the case that the points are expected to be located on the desired wall surface, we recommend visualizing this surface only while making the other surfaces invisible during the point-picking.
Alternatively, you can generate the points using another ANSYS application (for example, ICEM-CFD), record their coordinates in a .csv file, and directly import them into the table mentioned above. To do this, simply click the Load CSV button in the Point Cloud Editor, and select the .csv file.
Note: In the case that the point cloud is used for Wall Sampling, the specified point locations must be close enough to a wall surface so that the heat transfer variable output is valid.
To export or import .csv-formatted data, click the corresponding buttons in the Editor’s lower right corner. In the .csv file, the x-, y-, and z- coordinates are reported in centimeters (cm) in three columns, respectively, with no heading.