


The Contour Overlay option allows easy creation of Phi-T plots. A Phi-T plot is a contour overlay plot that is used typically to plot soot or soot-precursor and NO x contours as a function of equivalence ratio (phi or φ) and temperature (T). The presentation in the Ansys Forte Visualizer, however, is general-purpose, so it can be used to map Ansys Forte results against other information that is presented in a contour-plot map.
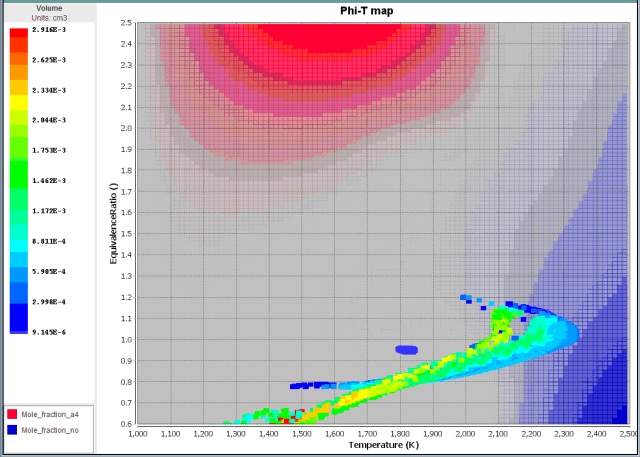
To create the underlying map (for example, the Phi-T contour overlay for soot and NO x), you first must import a CSV data file that contains data that is a function of two independent variables (for example, equivalence ratio and temperature), which is required for the Contour Overlay. A sample CSV file, diesel_phi_T_contour.ckcsv, is provided in the Ansys Forte data/phi_T_maps directory. Once the source file is opened and the data has been read in, you can then create a Contour Overlay plot. In the Phi-T Plot Editor panel, you may specify one or more Z variables for the displayed contours in the Background Contour sub-panel. For example, with the sample Phi-T plot, we would select A4 (pyrene) to represent soot and NO to represent NO x, as a function of equivalence ratio on the X axis and Temperature on the Y axis. Since these contours will be overlaid on the same plot, it is helpful to use a different color for the contours of each variable. Right-clicking on any entry in the Z variable list will allow you to select the contour color. Once the Background Contours have been established, you can then select the Ansys Forte solution points to plot on this map. For the Phi-T example, you can plot scatter points for all cells in the Ansys Forte solution, based on the equivalence ratio and temperature of each cell. How these cells intersect with the "islands" representing soot or NO x from a detailed kinetics simulation, for example, will give some indication of where and when soot is formed. In the Scattered Points tab, you can select one, a range of, or all solution time points in the solution to plot on the Contour Overlay. An example of a compound Phi-T plot is shown in Figure 5.9: Phi-T map with both A4 and NO chosen as contours, with each cell representing a single point overlaid .
Figure 5.9: Phi-T map with both A4 and NO chosen as contours, with each cell representing a single point overlaid
Source of Sample Phi-T Plot
The sample CSV file, diesel_phi_T_contour.ckcsv, was generated with an Ansys Chemkin homogeneous batch reactor model, using the conditions of 6 MPa pressure and 2 msec residence time, to match those used by Kaario et al. [14].
A mechanism of 3806 species, and 15718 reactions developed for the Model Fuels Consortium [15] in 2009 was used to generate this input file. The surrogate fuel used in this instance was developed by Naik et al. [22] which contains a mixture of heptamethylnonane, n-hexadecane, methyl cyclohexane, decalin, n-propyl benzene, hexene, and methyl naphthalene.
The content of the file uses reactor initial conditions of Temperature and Equivalence Ratio ranging from 500–2500 K, and 0.2–3.0, respectively. Typical representatives of NO x and soot are NO and pyrene; these are the defaults chosen by the Phi-T Plot wizard utility.