You can calculate the Knock index using data sampled at a specified point probe that has been sampled at a higher frequency than the sampling of averaged data.
To do this, create a line plot using sampled data, such as probed data.
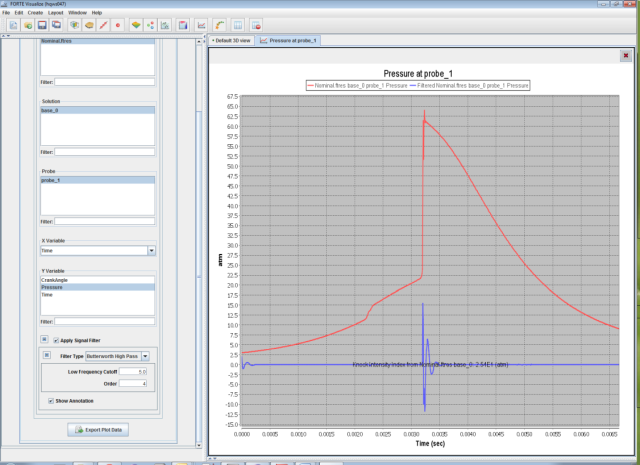
The probed data can then be run through a selection of Infinite Impulse Response filters, which are set up to isolate the knocking behavior sampled at a probe point. In Figure 5.8: Knock intensity as determined with the Butterworth high pass filter , the Butterworth high pass filter is applied to the probed pressure data to determine the knock intensity.
The Knock Intensity Index is calculated from a Butterworth high pass filter applied to a pressure trace. It is the maximum peak-to-peak signal in the resulting signal.
 | (5–1) |
where P(BWHP) is the Butterworth filtered pressure and the delta represents the maximum peak to valley value.