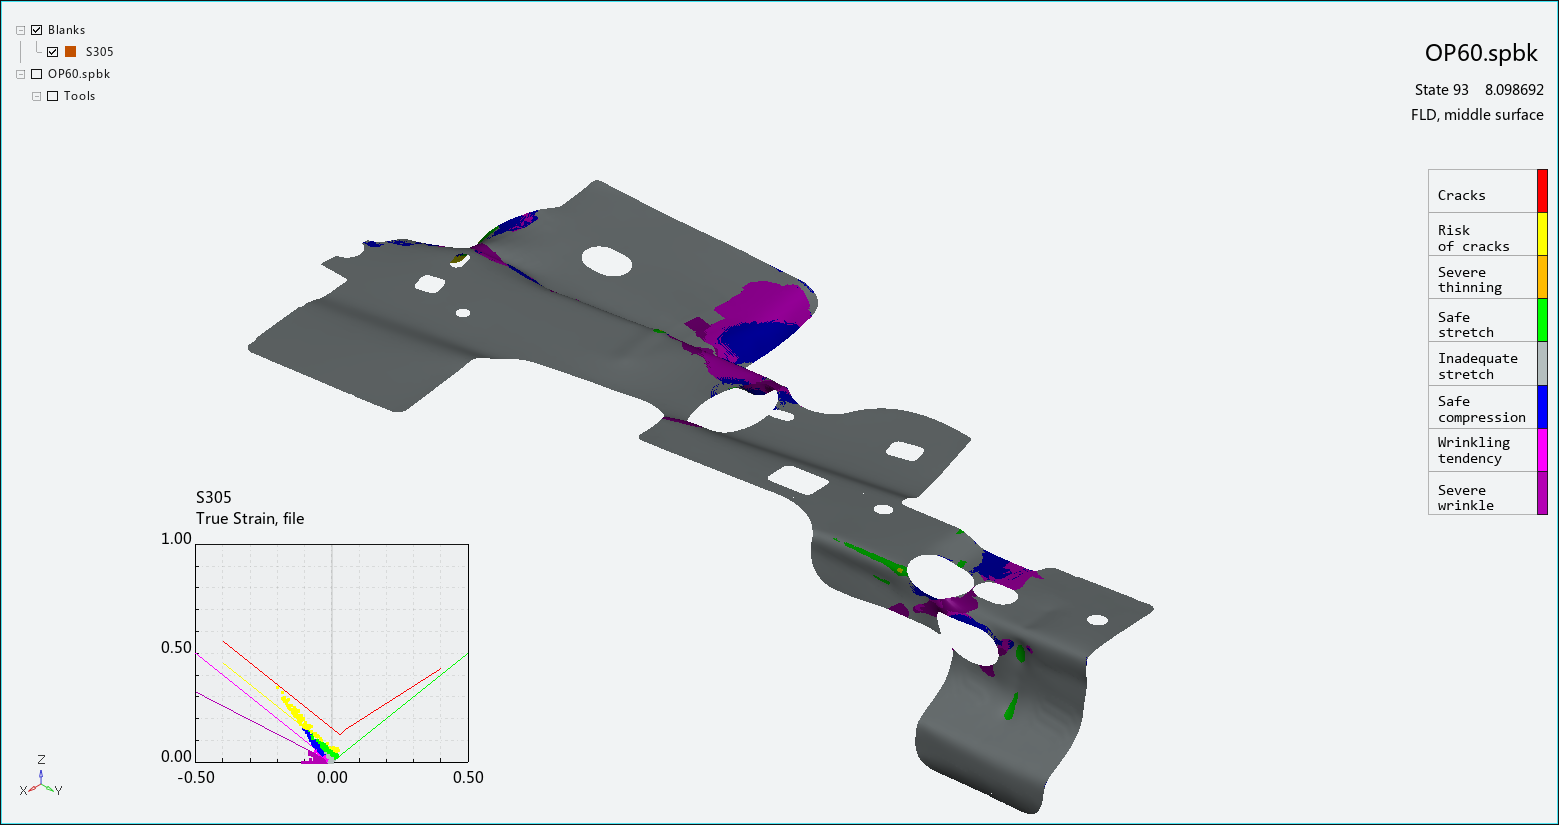
The forming limit diagram (FLD) displays a plot of true strain or engineering strain values on the blank while operations are being performed. Choose from the Analysis Ribbon Elements to display the FLD task panel and display the forming limit diagram in the Graphics Window.
Important: You must define the FLD of the material before you start the simulation, in the Material Editor while you are designing the blank(s), if you wish to evaluate material formability during postprocessing.
If you have not defined the FLD of the material, you must return to the Blank tab and edit the blank material to include FLD, then re-run the simulation, before you can use FLD to evaluate material formability.
See Define the Blank Material and Material Editor/Viewer for more information about defining the blank material and FLD.
The FLD Window graph in the lower left displays the distribution of strain values in the blank during the current frame. A legend along the right edge of the Graphics Window displays the meaning of each color in the FLD Curve and Window. Use your mouse pointer to move or resize the FLD Window.
Use the FLD task panel to select individual operations to view, or to play an animation of the forming process. The panel also enables you to set options for display of the FLD.
If there are multiple materials defined in the project, choose the blank from the first FLD Option drop-down menu and other options from that section to specify which blank is of interest.
By default, True strain is displayed both in the FLD Window and on the blank. In the task panel, select the check box next to Engineering Strain to switch. Clear the check box to return to true strain.
You may also choose to view strain at the , , or layer of the blank by choosing from the drop-down menu, or choose from the menu to display the maximum value from all layers. Select the Smooth Results check box to apply a smoothing function that yields a more attractive plot. Clear the check box to display a more accurate plot.
Click or to use the List Value Task Panel to pick points to display the numerical strain values at those points on the FLD and the locations of those points on the graph. Click to remove those callouts.
Click to select curve parameters and region filters for the FLD Curve.
Click to choose options for the FLD Window.
When you are finished with the FLD, click the button to return to Viewing Basic Deformation Results.


