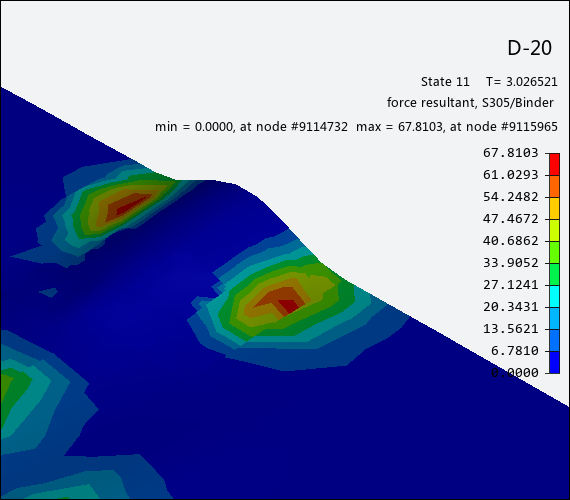
This tool displays contact result information as a contour plot directly on the blank. Choose from the Analysis Ribbon Elements to display the Contact Result task panel and view a contour plot of contact information in the Graphics Window.
Use the Contact Result task panel to select individual operations and states to view, or to play an animation of the forming process with contact data displayed as a contour plot on the workpiece. A legend along the right edge of the Graphics Window displays the value of each color used in the plot.
In the Component section of the task panel, choose a Blank on which to display contact result data from the drop-down menu, and one of the Tools for which to display contact result data from the next drop-down menu. Then, select a specific data component to display. Available components are:
| normal interface pressure |
| maximum interface shear stress |
| shear stress in local r-direction |
| shear stress in local s-direction |
| x-force |
| y-force |
| z-force |
| force resultant |
| contact gap |
Select the Smooth Results check box to apply a smoothing function that yields a more attractive plot. Clear the check box to display a more accurate plot.
Click to use the List Value Task Panel to pick points to display the numerical values at those points on the plot.
Click to use the Contour Setting Task Panel to modify the settings of the plot contours.
When you are finished with the Contact Info. plot, click .


