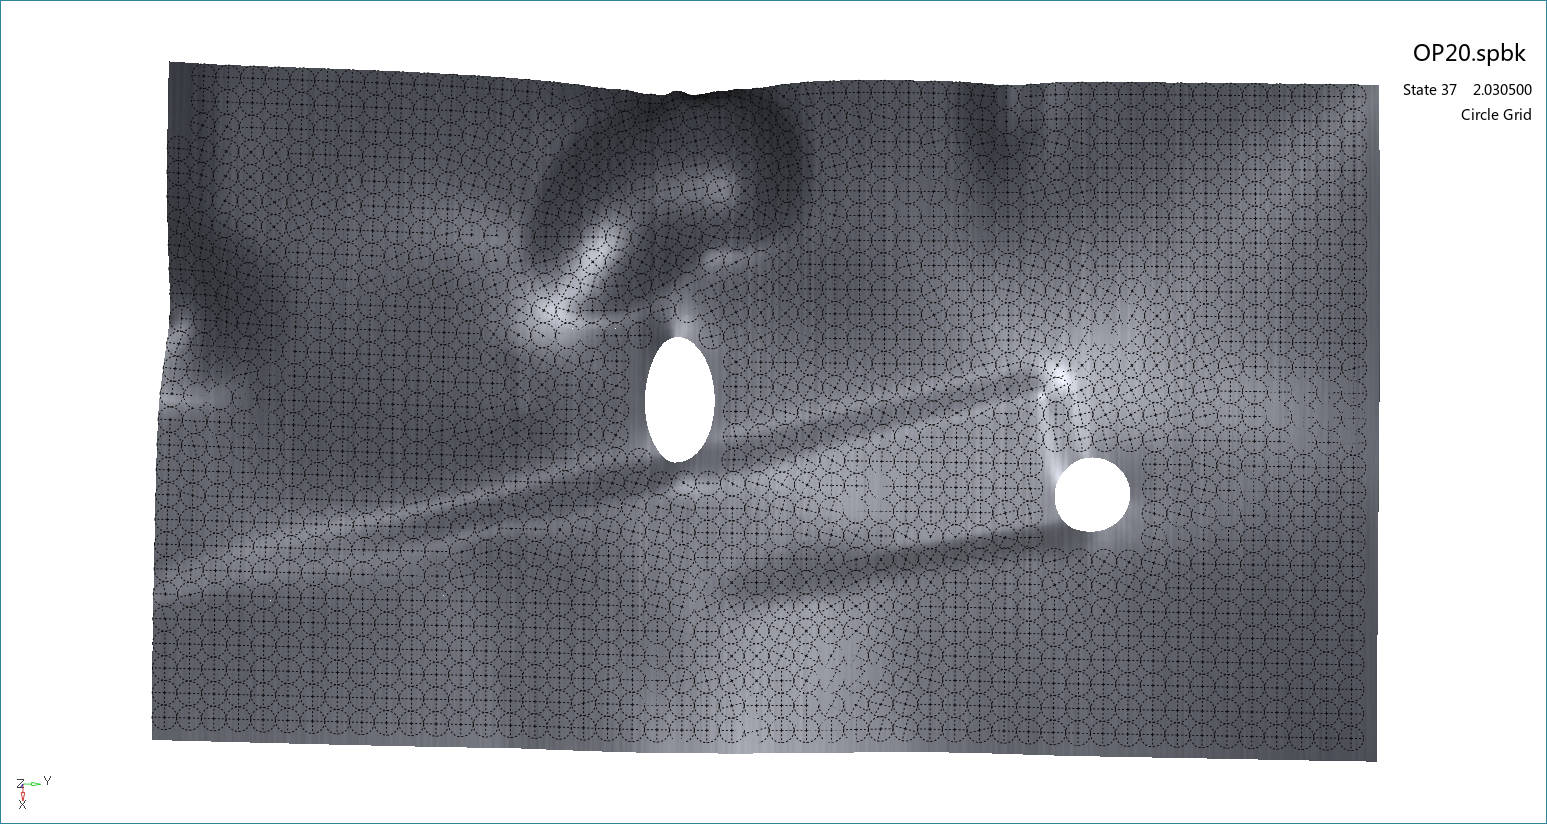
The circle grid function enables you to understand how the blank will behave during the forming process. Choose from the Analysis Ribbon Elements to display the Circle Grid task panel and view a plot of analysis data in the Graphics Window that displays the strain on circular regions in the workpiece.
Initial perfect circles are printed on the flat blank sheet. These circles will deform with the movement of the material at that point. Use the Circle Grid task panel to select individual operations to view, or to play an animation of the forming process.
To display the circle grid on the blank, you must first click .
To change the diameter of the circles, enter a new value in the Diameter field and click . To return to the default diameter, click , then click .
The following options can be applied to the display by checking or clearing the check box next to the option:
- Show Blank
When checked, the blank is displayed. Clear this check box to view the grid without the underlying blank.
- Show Circle
When checked, the circles and grid lines are both displayed. Clear this check box to view the grid lines without circles.
- True Strain
When checked, the software uses calculated true strain values to align and determine the circle grid. Clear this check box to view a circle grid based on engineering strain.
- Plot Contour
When checked, the grid lines also display contour coloration based on strain values. A legend provides values for the colors. Clear this check box to display grid lines and circles in the same color.
Click to use the LCS task panel to define a local coordinate system.
Click to use the List Value Task Panel to pick points to display the numerical strain values at those points on the plot.
Click to use the Contour Setting Task Panel to modify the settings of the circle grid plot contours. If you change contour settings, when you return to the Circle Grid task panel you must click to display the circle grid using the new settings.
When you are finished with the circle grid plot, click the button to return to Viewing Basic Deformation Results.


