


You can visually monitor solution convergence data for your Fluent simulations in Workbench using solution monitoring charts. To control the display of the solution monitoring charts, select the Solution Monitoring option in the Properties pane for the Solution cell.
Once this option is enabled, you can open the solution monitor workspace from within Workbench by right-clicking a Fluent-based system Solution cell and selecting the Show Solution Monitoring command from the context menu.
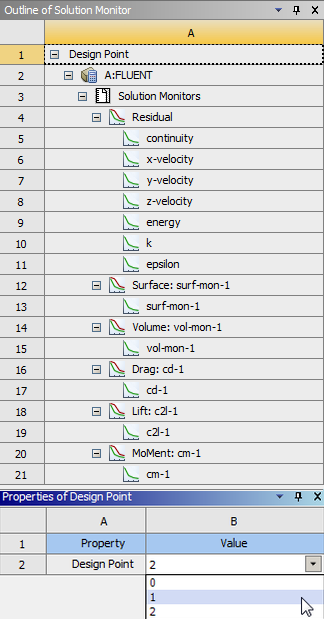
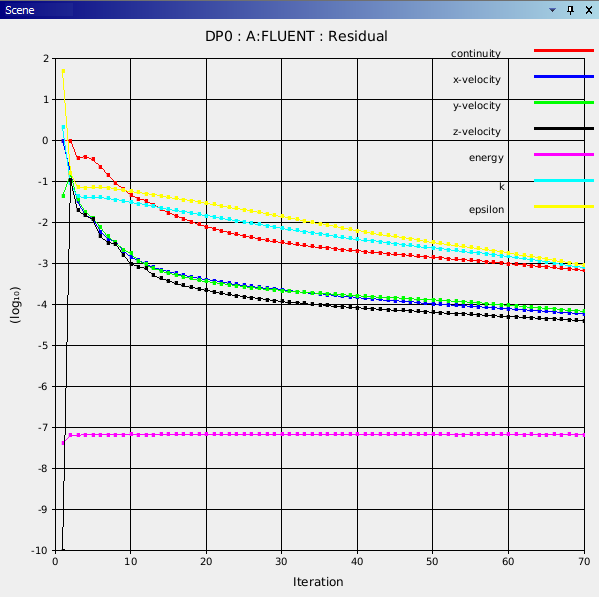
The Show Solution Monitoring command opens the Solution tab with an Outline pane for the Solution Monitors cell (see Figure 2.2: Example of the Solution Monitors Outline Pane Within Workbench) and a chart for the system (see Figure 2.3: Example of a Fluent Scene Pane within Workbench).
The Outline Pane
The following types of monitors are available in the Outline of Solution Monitor pane:
Residual convergence monitors, such as Continuity, Energy, Velocity, and so on
User-defined monitors that have been defined in Fluent, such as Surface, Volume, Lift, Drag, and Moment based monitors.
The residual convergence monitors are grouped under the Residual group. User-defined monitors are listed with
their names specified in Fluent under corresponding monitor groups.
The default names for monitor groups have the following pattern:
type-name
, where
type
is the
type of user-defined monitor and
name
is the monitor name defined in Fluent. You can edit
the names of the monitor groups directly in the cells. The monitor
names can only be edited in Fluent.
The Scene Pane
As the Fluent simulation progresses, the convergence graphs are plotted interactively in the Scene pane. By default, Workbench displays a fully populated residual convergence chart (for example, continuity, energy, velocity, and so on). The user-defined monitor charts (that is, force, moment, and integrals) are not displayed by default. To view user-defined monitor plots, click the corresponding cell in the Outline of Solution Monitor pane.
Once the solution is complete, or while the solution is progressing, right-click the cell for the appropriate monitor group and select Remove Variable, Add Variables, or Add All Variables (if applicable) from the context menu to add or remove available residual and/or user-defined monitors in the Fluent Scene pane (see Figure 2.3: Example of a Fluent Scene Pane within Workbench). You can create a new residual or user-defined chart by right-clicking the Solution Monitors cell in the Outline pane and selecting Create Residual Monitor Chart or Create User-Defined Monitor Chart respectively from the context menu.
The solution monitor chart is embedded in the Workbench Scene pane and once it is visible, it can be hidden and displayed by disabling or enabling the View > Scene menu option, respectively. You can save the chart that you are viewing as a graphic by right-clicking the background of the chart and select Save Image As from the context menu. You can alter the appearance of individual plots by changing Color, Line Width and Symbol Size in the Properties pane for the correspondent plot cells. You can control the settings for the monitor charts in the Scene pane using the Properties pane for the monitor groups as described in Setting Chart Properties in the Workbench User's Guide.
Note: Solution monitoring in Ansys Workbench provides only basic insight into the convergence process of your simulation. To access full spectrum of solution monitoring features available in Ansys Fluent, you need to run an interactive session in Fluent.
You can also monitor the solution convergence of any design points in your simulation. When you perform an update of all design points during the calculation, the Design Point value (as shown in Figure 2.2: Example of the Solution Monitors Outline Pane Within Workbench) changes internally and will be in read-only mode. Once all of the design points are updated, you can change the Design Point value (using the corresponding drop-down menu) to view the data of any design point. Once the Design Point is selected, then the data of the selected system will be displayed in the Scene pane.
Note:
For the following situations, solution monitoring data will become available only at the end of the calculation and the chart will not be updated during the calculation:
when you run a parametric study in the foreground and you update the Solution cell in the background, or
when you remotely run a parametric study, for example, calculating design points using the Remote Solve Manager (RSM) for the parameter set.
All residual monitoring data is plotted with iteration number as X axis data. User-defined monitors can be plotted with Iteration, Flow Time, or Time Step as the X axis quantity.
For more information about using charts in Workbench, see Working with the Chart Pane.
The Fluent Transcript Pane
The Fluent Transcript pane displays the content of the Fluent solution transcript. To close the Fluent Transcript pane, deselect it from the View menu of the Solution tab.
In a design point study, you can review the solution transcript for each design point (if available) by selecting the design point in the Properties pane for the Design Point cell as shown in Figure 2.2: Example of the Solution Monitors Outline Pane Within Workbench. By default, the transcript for the current design point is displayed.
When simulating multiple systems, you can review the transcript for each system (if available) by clicking any cell relevant to the system of interest in the Outline pane.
During the foreground or component-level local Remote Solve Manager (RSM) update of the system, the Fluent Transcript pane will continue being updated with the solution progress information.
You can use the following standard keyboard short-cuts to navigate through the content displayed in the Fluent Transcript pane:
Page Up and Page Down to scroll up or down one page, respectively
Ctrl+Home and Ctrl+End to jump to the top or the bottom of the transcript, respectively
The Fluent Result Image Pane
The Fluent Solution Images pane displays contour and vector plots that have been previously defined in Fluent (see Creating and Using Contour Plot Definitions and Creating and Using Vector Plot Definitions in the Fluent User's Guide for details). To access the Fluent Solution Images pane, select Fluent Solution Images from the View menu of the Solution tab. You can use the scroll bar or standard navigation keyboard buttons (Page Up, Page Down, Ctrl+Home and Ctrl+End) to view a desired plot.
Similar to the Fluent Transcript pane, if you are running a design point study, you can review solution plots for each design point by selecting the desired design point in the Properties pane for the Design Point cell.
To close the Fluent Solution Images pane, deselect it from the View menu of the Solution tab.
To return to viewing the Project Schematic, click the Project tab above the Workbench toolbar.
Note: Fluent Solution Images are not populated when running Fluent in the background or via the Remote Solve Manager.