


The following sections of this chapter are:
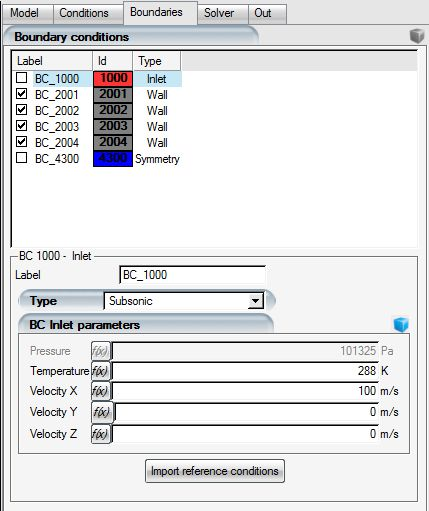
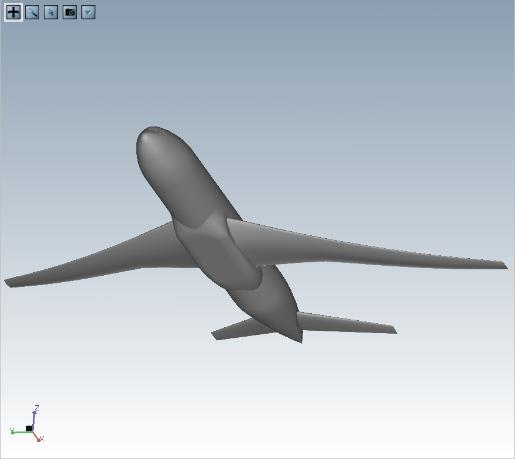
By default, selected boundaries of the computational domain are shown in white, inlets in red, other boundaries in blue and all solid surfaces in grey.
The Boundary conditions section of the parameter window can be used to add more geometrical details in the graphical window. This menu varies from one solver to another; refer to subsequent chapters of this manual for selecting the boundary conditions tags.
The level of detail displayed in the graphical window can be defined using the display box icon located on the left below the graphical window:
Clicking this icon opens a menu that provides access to the configuration of the display settings:
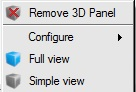
Select to remove the graphical
display. The display box icon changes to ![]() .
.
Click again on the display box icon and select either or to reactivate the graphical display.
The mode displays all geometrical features that have been defined with the option. In mode, the graphical box icon is shown in blue:
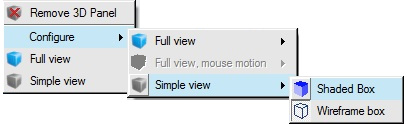
The displays all geometrical features as bounding boxes. This option may be useful to speed-up the graphical refresh time on some computers. In mode, the graphical box icon is shown in grey:
Both display modes can be customized using the menu option:
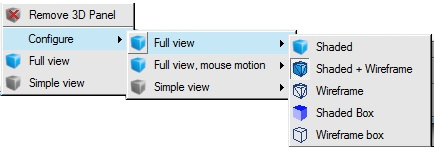
Table 3.1: Configure Menu Options
| Shows the selected boundaries of the computational domain as a colored surfaces. | |
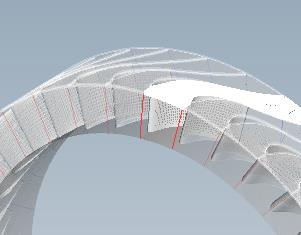
| Adds the surface grid to the Shaded surface. | |
| Only displays the grid on each selected boundary. | |
| Displays the selected boundary as a colored boundary box. | |
| Displays the selected boundary as a transparent bounding box. |
The menu applies to the graphical display when the mouse is in movement. The menu only offers the shaded and wireframe box options.
The axis display shows the current view direction:

It can also be used to align the display along prescribed directions:
Click any axis to align the view along that axis;
Click the central gray box (at origin of the axis) to reset the view to its original 45 deg. Isometric view;
Right-mouse click the axis area to open a new menu proposing 6 preset view directions and two isometric views.
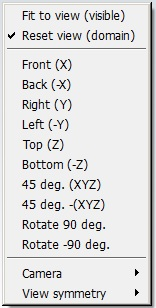
Right-mouse click in the axis area and select to center the graphical features currently displayed in the graphical window.
This option displays the grid by applying either translational or rotational periodicity:
Right-click in the axis area to open the display menu, and select . The , and symmetry planes are used for translational periodicity:
The , or rotation options are used with rotational periodicity:
For rotational periodicity, both the rotation angle (in degrees) and the number of repetitions are required.
Click the first icon at the top left of the graphical window to enable object
displacement  . To rotate (left-click), pan (center-click), and zoom
(right-click) on the object. You can also zoom on the object with a bounding box
by holding down the Ctrl key while pressing the left mouse
button.
. To rotate (left-click), pan (center-click), and zoom
(right-click) on the object. You can also zoom on the object with a bounding box
by holding down the Ctrl key while pressing the left mouse
button.
Click the second icon (zoom) button  for an interactive zoom (left-click). Center-click to undo
the zoom.
for an interactive zoom (left-click). Center-click to undo
the zoom.
Click the selection icon ![]() to select a geometrical feature in the graphical window by
clicking it with the mouse.
to select a geometrical feature in the graphical window by
clicking it with the mouse.
This can be useful for selecting a specific boundary interactively from the graphical window, particularly when many surfaces are grouped into a family, instead of cycling through the list of boundary conditions shown in the Boundary conditions menu.