


Once the solve has been initiated, there are a number of ways to monitor how well it is performing. Different data and values can give clues as to which parts of the simulation are going well and which aren't. You can also see what might be the reason for a slowdown in the simulation.
The main monitoring tool is the Solver Output viewed from the Solution Information object. Solution output is constantly updated, providing information for each cycle - the cycle number, the simulation time, the time step (time increment), the progress (in percent) and the estimated run time remaining. An indication of an issue here would be inconsistency in the estimated time remaining or a decrease of the time increment. This can be more precisely monitored by viewing the Time Increment graph of the time step value with respect to simulation time. There are also a number of graphs available under the Solver Output to help you determine the health of your solve.
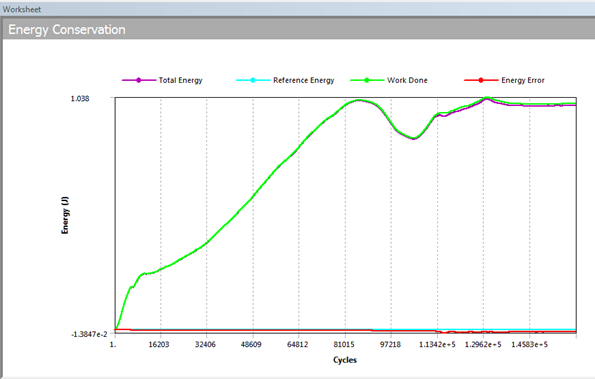
Energy error can also indicate problems in the simulation. You can keep track of it with the Energy Conservation graph (seen in Figure 8.17: Graph of Energy Conservation for an Explicit Simulation) which also shows the total energy and work done in the solve. The default threshold is 10%; any error above this will terminate the solve. The reference value for the energy is usually the zero cycle. These values can be altered in the Analysis Settings. Sometimes it is useful to see what is happening in the simulation even though there is a large energy error. There are two ways this can be achieved - either increasing the reference cycle so that its value is higher than or equal to the maximum number of cycles, or increasing the Maximum Energy Error value. This should only be done to observe what is happening during the solve that gives rise to the error. The results of a simulation completed with high energy errors should not be considered accurate.
The Momentum Summary graph is also useful for monitoring the dynamics of the simulation, and it can give some indication of a stability problem. The last monitoring tool is the Energy Summary graph. High values of hourglass energy here usually indicate problems with the mesh. This graph also shows the kinetic energy during the solve. The value should be insignificant with respect to the model in the quasi static simulations to ensure that inertial effects are not altering the results.
Another way to monitor the solve is through Results Trackers. These update in real time, giving information about their values for each cycle, or at whatever frequency is set in the Output Controls in the Analysis Settings. These trackers have to be defined before the start of a solve, and in order to suppress or remove them they have to be cleared from the data. They cannot be added at a restart point or at the end of a solve. The other results tools can only be examined after the solve stops (see Result Sets). If a live picture of what is happening during the solve is required, the Autodyn component system can be used. It can refresh the visualization of the solution as often as each cycle and can show various details about whole bodies like velocity vectors, stresses, other data values, and more.
When the solve is initiated, the checks done before the first cycle can find problems and
produce warning or error messages. These are usually related to the material models, the boundary
conditions setup, or the restart options. When a General failure error is
seen, this usually means there are possible problems with the licensing or the remote solve
manager, but it can also signify other problems. Errors or warnings can also be seen during or
after the solve. The two primary reasons for a terminated solve are the Energy error
exceeded and Time step too small errors. Both of them can
mean a variety of problems - meshing, high deformation, incorrectly applied forces, etc. Usually
observing the results up to that point or using the erosion or error options to bypass the
termination should give an indication of what the problem might be.