The virtual mass force is caused by the fact that when the particle accelerates it drags some of the surrounding mass of the fluid. This mass portion is supposed to attain the particle velocity, resulting in a virtual increase in the particle mass. This force is significant when the density of the fluid phase is similar or higher than the density of the particles, such as in light particles flowing in water.
The virtual mass force is defined by the expression:
 | (3–64) |
where  represents the mass of fluid displaced by the particle, whereas
 is the relative acceleration. The virtual mass coefficient,
  , represents the particle volume of displaced fluid that contributes to the
effective virtual mass of the particle, in terms of a fraction of the particle volume.
, represents the particle volume of displaced fluid that contributes to the
effective virtual mass of the particle, in terms of a fraction of the particle volume.
The theoretical value of  for a sphere in an infinite medium is 0.5. However, for higher particle
volume fractions, particles interaction effects become important, increasing the fluid mass
displaced. In general, it depends on particle shape and particle concentration.
for a sphere in an infinite medium is 0.5. However, for higher particle
volume fractions, particles interaction effects become important, increasing the fluid mass
displaced. In general, it depends on particle shape and particle concentration.
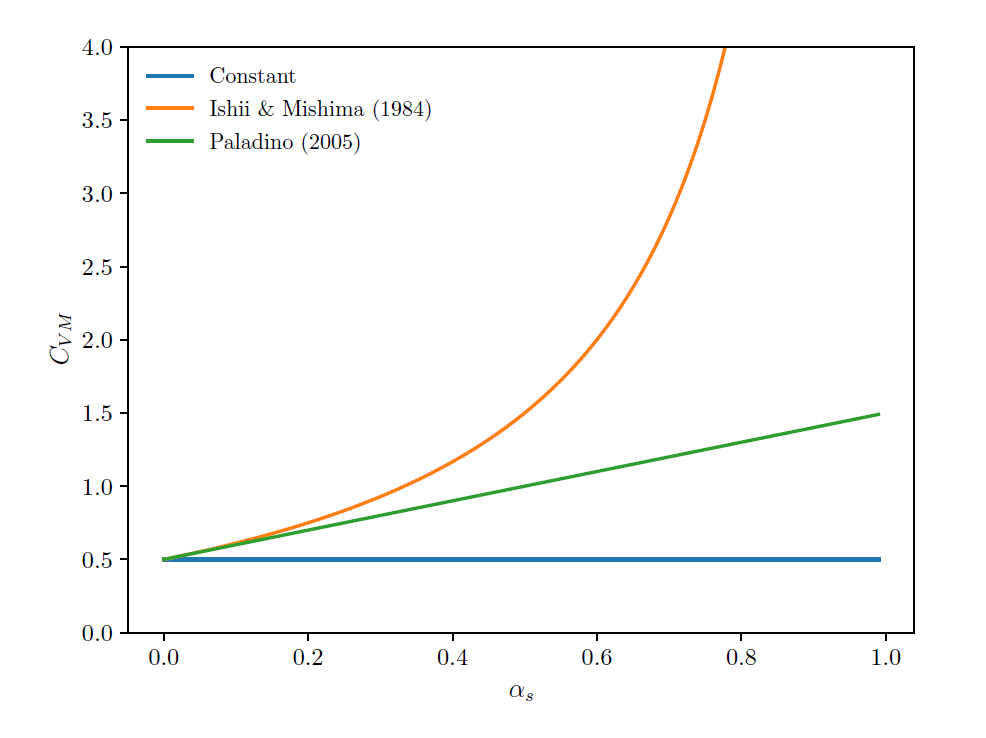
Three models are currently implemented in Rocky DEM-CFD coupling and are described in the following sections.
As already mentioned, the theoretical value for  for a sphere in an infinite medium is 0.5. So, when the constant value
option is chosen the virtual mass coefficient is set with that value:
for a sphere in an infinite medium is 0.5. So, when the constant value
option is chosen the virtual mass coefficient is set with that value:
 | (3–65) |
Ishii & Mishima [28] calculated the virtual mass
coefficient as a function of the volume fraction of the fluid phase, according to the
expression: 
Paladino [27] suggested a virtual mass coefficient as a function of the volume fraction of the fluid phase. This model showed results for the differential pressure in excellent agreement with experimental data published by Lewis and Davidson [26]. The Paladino virtual mass coefficient is given by:
 | (3–66) |
Figure 3.7: Comparison of virtual mass models as the volume fraction of the solid phase varies. compares the behavior of each virtual mass model with the increase of the solid phase volume fraction.