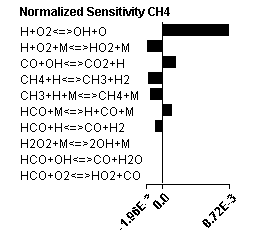
Selecting a species in the Reaction Path Diagram will activate the lower right panel, displaying all sensitivity coefficients that have been calculated for the selected species. If there are no sensitivity data in the Ansys Chemkin solution file, no sensitivity bar chart will be displayed. When available, data is displayed in bar-graph form, providing the normalized, relative sensitivity of the species to each reaction, as shown in Figure 4.3: Sensitivity plot for the H2O2 species.