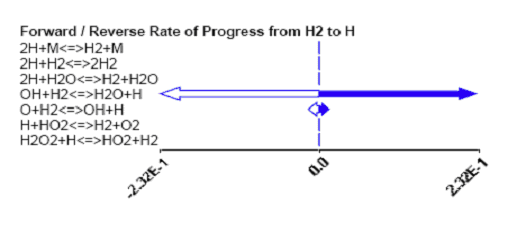
Selecting a connection path in the Reaction Path Diagram will activate the lower right panel, displaying all forward and reverse reaction rates for each reaction that is a contributor to the selected connection path. As shown in Figure 4.4: Forward and reverse rate of progress chart, the forward and reverse rates are charted to show their relative sizes.