When the Reaction Path Analyzer is opened, a large primary window is visible which displays data and has a side-panel that controls which data are displayed and how they are presented. The large primary window is composed of three sections, as shown in Figure 4.1: The main Reaction Path Analyzer panel, showing the Reaction Path Diagram, the Rate of Production area, and the Sensitivity area, and the Solution tab of the Control panel.: the Reaction Path Diagram, the Rate of Production Bar Graph, and either the Sensitivity bar graph or the Forward and Reverse Rate-of-progress bar graph. Figure 4.2: The Reaction Path Analyzer Control Panel, which controls what data is being displayed in the Reaction Path Diagram. shows the control panel that displays on the right side, with options to change the constraints used in generating and displaying the path diagram, based on the current Ansys Chemkin solution. These components are described briefly below, while Using the Reaction Path Analyzer contains instructions on how to modify the display characteristics.
Figure 4.1: The main Reaction Path Analyzer panel, showing the Reaction Path Diagram, the Rate of Production area, and the Sensitivity area, and the Solution tab of the Control panel.
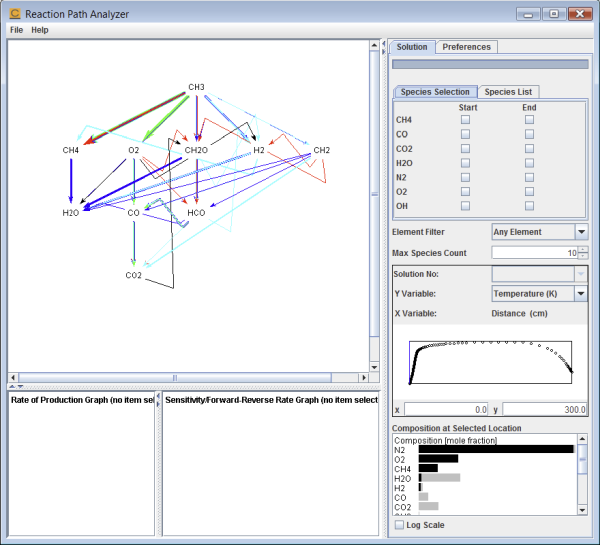
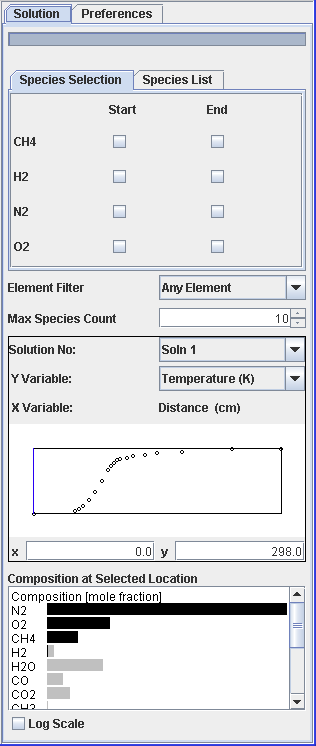
Figure 4.2: The Reaction Path Analyzer Control Panel, which controls what data is being displayed in the Reaction Path Diagram.