The Control Panel contains access to elements that modify the form of the Reaction Path Diagram being displayed, as well as graphical tools to help determine which time or space solution point is currently being displayed. These components of the Control Panel are described briefly below, while instructions on how to use these components is provided in Using the Reaction Path Analyzer.
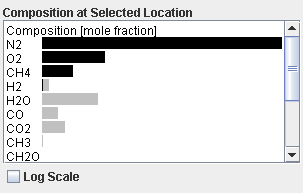
The Composition display is a graphical representation of the local values for species at the selected point in the Ansys Chemkin solution. The relative contribution of each species is displayed in a bar graph chart as shown in Figure 4.5: Composition display. The maximum species fraction that occurs at any point in the Chemkin solution is displayed as a gray bar behind the black bar showing the local value. By default, the composition bar chart is displayed on a linear scale, but this can be changed to a log scale.
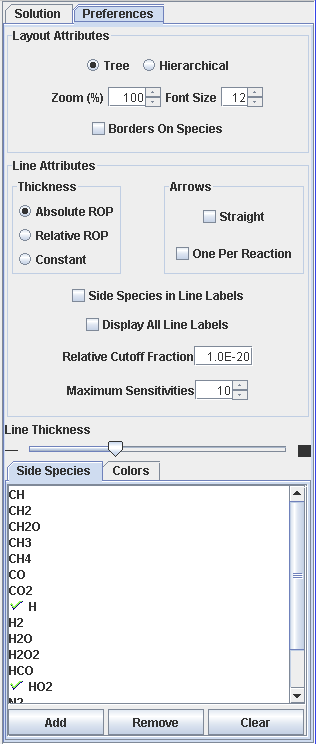
To change user preferences for the Reaction Path Analyzer, click the Preferences tab, shown in Figure 4.6: Preferences panel. The Preferences panel allows the setting of options that dictate the behavior of the Reaction Path Diagram. The purpose of these options is described in more detail in the following section.