


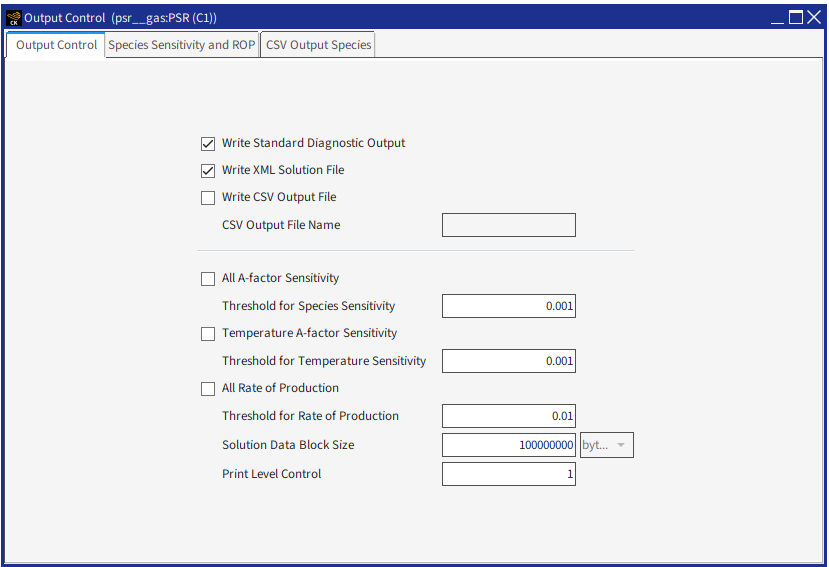
Double-clicking on the next node causes the Output Control panel to be displayed, as shown in Figure 2.14: psr__gas.ckprj—Output Control. By default, a job "run" will create an Ansys Chemkin solution file (in a zipped XML format) and a diagnostic output file, each containing state information for solution variables. The Output Control panel contains the Output Control tab as well as the Species Sensitivity and ROP tab. The Output Control tab may contain three sub-tabs for transient simulations: Basic, Ignition Delay, and Heat Release, and only the Basic panel for steady-state simulations. The Basic tab allows users to request additional output, such as sensitivity coefficients or species rates of production. The Ignition Delay tab gives users some new definitions by which the ignition delay times can be calculated (see Species Molar Entropy of the Chemkin Theory Manual for more information). Users can also set the print level for the diagnostic output file and other print-out controls. The Heat Release tab provides two options for calculating heat release. For details about these options, see Gas Energy Equation of the Chemkin Theory Manual.
The Species Sensitivity and ROP tab allows you to select specific species for which the sensitivity coefficient and ROP are calculated.
For some Ansys Chemkin reactor models, an option is available to write the output data in a CSV file. This output mode allows a quick (but less inclusive) way to review the results or post-process data using third-party tools, such as Microsoft Excel (see Excel Settings in the Chemkin Visualization Manual for details on configuring Excel). The reactor models that support this option are: the closed 0-D reactors, the plug-flow reactors, and the flame-simulators. For the flame simulator models, note that this output method is intended for the basic individual reactors such as burner-stabilized, freely propagating, and opposed-flow-flame rather than the more parametric models, such as the extinction and flame-speed table.
Figure 2.15: psr__gas.ckprj—Output Control for 0-D reactors shows the generic output control panel for 0-D reactors. It illustrates that each output mode (when applicable and available) can be selected independently. Note that even if only CSV output is selected, some of the diagnostics information may be echoed in the normal text output file. In general, suppressing the XML or standard output may result in better run-time performance, since the I/O operations are avoided. However, it should be noted that when no XML solutions are written, no post-processing can be done through the Chemkin user interface.

The default output file name for the CSV is Output.csv and that can be changed using the text-box input labeled CSV Output File Name.
CSV output is particularly useful for quickly plotting the canonical output such as temperature, pressure, or volume, etc., along with species, as a function of time or distance. The species can be selected using the drop-down selection list on the "CSV Output Parameters" tab. The other output variables are pre-selected by Chemkin based on the reactor model and, at the time of this release, are not user-customizable as of this release. Table 2.10: Non-user-customizable variables written in CSV output shows the list of non-customizable variables written in the CSV output file.
Table 2.10: Non-user-customizable variables written in CSV output
| Reactor Model | Non-customizable output variables in CSV output |
| 0-D | Pressure and volume (if solved), Temperature |
| Plug Flow (PFR) | Velocity, Flow-residence-time (if solved), Temperature |
| Flame simulators | Temperature |
For IC-engine-based reactor models, only the cylinder-averaged data are written. If the method of moments model or sectional method is selected to solve for particles, then the corresponding data, that is, the moments of the distribution and the sectional number density, respectively, are written. As of the 2020 R2 release, aggregate information and PSD (that is, dNdLogD) is not written to CSV. In general, each row of output starts with the time or distance coordinate followed by the selected species mass-fractions for gas-phase and/or site-fractions for surface species and then the other variables. Note that the species are listed in the order in which they appear in the mechanism. The gas-phase and the surface species column headers follow Y_SpeciesName and Z_SpeciesNames nomenclature, respectively. Temperature is always written at the end.