


VM259
VM259
Missing Mass with Rigid Responses Effects in Spectrum
Analysis for BM3 Piping Model
Overview
Test Case
The BM3 piping model is meshed with PIPE16 and PIPE18 elements. The model is supported by elastic spring-damper elements (COMBIN14). Lumped mass matrix formulation is used in the modal analysis (LUMPM). Single point response spectrum analysis is then performed with an acceleration input spectra defined by 75 points (FREQ and SV). The first 14 modes are included in the spectrum analysis. The model is excited in X direction and the modal responses are combined using SRSS mode combination method with displacement solution output. The analysis is performed for three cases:
With missing mass effect (ZPA=0.54g).
With missing mass (ZPA=0.54g) and rigid responses effect (Lindley Method).
With missing mass (ZPA=0.54g) and rigid responses effect (Gupta Method, F1=2.8Hz and F2=6.0Hz).
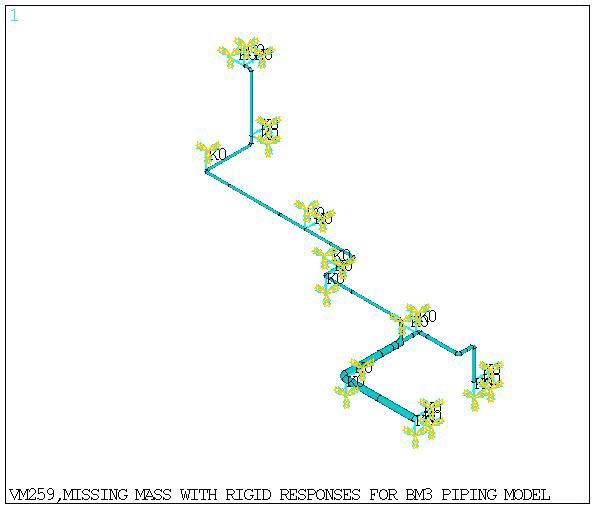
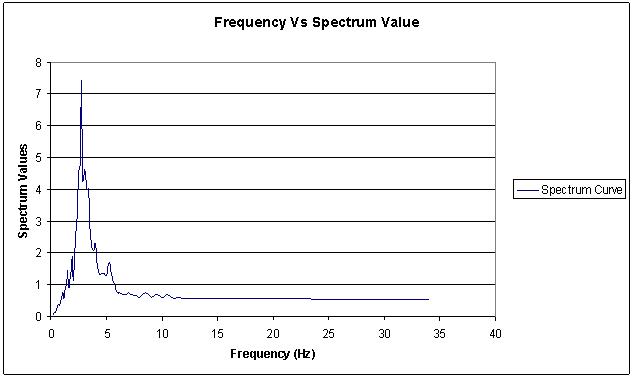
Table 12: Frequency versus Spectral values
| Frequency (Hz) | Spectrum Values | Frequency (Hz) | Spectrum Values |
| 0.2 | 0.06 | 2.1 | 1.18 |
| 0.3 | 0.13 | 2.2 | 2.65 |
| 0.4 | 0.13 | 2.3 | 2.85 |
| 0.5 | 0.2 | 2.4 | 3.26 |
| 0.6 | 0.35 | 2.5 | 4.47 |
| 0.7 | 0.39 | 2.6 | 4.75 |
| 0.8 | 0.37 | 2.7 | 5.29 |
| 0.9 | 0.41 | 2.8 | 7.44 |
| 1 | 0.76 | 2.9 | 4.27 |
| 1.1 | 0.64 | 3 | 4.61 |
| 1.2 | 0.59 | 3.15 | 4.13 |
| 1.3 | 0.91 | 3.3 | 3.96 |
| 1.4 | 1.03 | 3.45 | 4.05 |
| 1.5 | 1.46 | 3.6 | 2.44 |
| 1.6 | 0.95 | 3.8 | 2.09 |
| 1.7 | 0.91 | 4 | 2.29 |
| 1.8 | 1.61 | 4 | 2.29 |
| 1.9 | 1.92 | 4.2 | 1.52 |
| 2 | 1.57 | 4.4 | 1.34 |
| 4.6 | 1.37 | 10.5 | 0.7 |
| 4.8 | 1.36 | 11 | 0.59 |
| 5 | 1.31 | 11.5 | 0.61 |
| 5.25 | 1.69 | 12 | 0.56 |
| 5.5 | 1.27 | 12.5 | 0.59 |
| 5.75 | 1.04 | 13 | 0.59 |
| 6 | 0.76 | 13.5 | 0.59 |
| 6.25 | 0.76 | 14 | 0.58 |
| 6.5 | 0.69 | 14.5 | 0.59 |
| 6.75 | 0.7 | 15 | 0.58 |
| 7 | 0.74 | 16 | 0.55 |
| 7.25 | 0.7 | 17 | 0.56 |
| 7.5 | 0.67 | 18 | 0.55 |
| 7.75 | 0.66 | 20 | 0.55 |
| 8 | 0.61 | 22 | 0.55 |
| 8.5 | 0.75 | 25 | 0.54 |
| 9 | 0.6 | 28 | 0.54 |
| 9.5 | 0.69 | 31 | 0.54 |
| 10 | 0.61 | 34 | 0.54 |
| Material Properties | Geometric Properties | Loading |
Straight Pipe: E = 2.9E+7 lb/inch2 Nu = 0.3 DENS = 1.043e-03 lb-sec2/in4 Curved Pipe E = 2.9E+7 lb/inch2 Nu = 0.3 DENS = 1.043e-03 lb-sec2/in4 Spring-damper element K = 1.0e5 lb/inch | Straight pipe: (PIPE16) Type 1, real 1 OD = 3.500 in. Wall Thickness = 0.2160 in. Type 2, real 2 OD = 4.5000 in. Wall Thickness = 0.2370 in. Type 3, real 3 OD = 8.625 in. Wall Thickness = 0.3220 in. Curved Pipe: (PIPE18) Type 4, real 4 OD = 3.500 in. Wall Thickness = 0.2160 in. Radius of Curvature = 4.500 in. Type 5, real 5 in. OD = 4.5000 in. Wall Thickness = 0.2370 in. Radius of Curvature = 6.000 in. Type 6, real 6 OD = 8.625 in. Wall Thickness = 0.3220 in. Radius of Curvature = 12.000 in. | Spectrum curve Refer to the above defined (frequency versus spectrum values) table. |
Analysis Assumptions and Modeling Notes
Node coordinates and element characteristics are given in appendix A of the reference document cited in the "Overview". The same mesh is used in the analysis.
Frequencies obtained from the modal analysis and reaction forces at supports obtained from the spectrum analyses are compared with the reference solutions.
The reaction moments are not compared since the rotational degrees of freedom for curved pipe elements (PIPE18) are not included in the lumped mass matrix formulation.
Results Comparison
| Target | Mechanical APDL | Ratio | |
| Frequencies from the Modal Analysis | |||
| Mode1 | 2.9100 | 2.9068 | 0.999 |
| Mode2 | 4.3900 | 4.3837 | 0.999 |
| Mode3 | 5.5200 | 5.5151 | 0.999 |
| Mode4 | 5.7000 | 5.7018 | 1.000 |
| Mode5 | 6.9800 | 6.9784 | 1.000 |
| Mode6 | 7.3400 | 7.3427 | 1.000 |
| Mode7 | 7.8800 | 7.8778 | 1.000 |
| Mode8 | 10.3000 | 10.3961 | 1.009 |
| Mode9 | 11.0600 | 11.0623 | 1.000 |
| Mode10 | 11.2300 | 11.2323 | 1.000 |
| Mode11 | 11.5000 | 11.5321 | 1.003 |
| Mode12 | 12.4300 | 12.4550 | 1.002 |
| Mode13 | 13.8800 | 13.9647 | 1.006 |
| Mode14 | 16.1200 | 16.0920 | 0.998 |
| Reaction forces at support (Spectrum analysis performed with missing mass) | |||
| FX @ node 1 | 48.0810 | 48.1800 | 1.002 |
| FY @ node 1 | 5.4936 | 5.1448 | 0.937 |
| FZ @ node 1 | 7.5840 | 6.9158 | 0.912 |
| FX @ node 31 | 50.6460 | 50.1255 | 0.990 |
| FY @ node 31 | 24.7975 | 24.6397 | 0.994 |
| FZ @ node 31 | 31.6776 | 30.9950 | 0.978 |
| Reaction forces at support (Spectrum analysis performed with missing mass and rigid responses –Lindley method) | |||
| FX @ node 1 | 46.3326 | 46.2160 | 0.997 |
| FY @ node 1 | 3.7060 | 3.5775 | 0.965 |
| FZ @ node 1 | 3.5360 | 3.2326 | 0.914 |
| FX @ node 31 | 56.1510 | 56.6833 | 1.009 |
| FY @ node 31 | 17.8542 | 17.8876 | 1.002 |
| FZ @ node31 | 22.9944 | 22.4446 | 0.976 |
| Reaction forces at support (Spectrum analysis performed with missing mass and rigid responses – Gupta method) | |||
| FX @ node 1 | 45.4300 | 45.4499 | 1.000 |
| FY @ node 1 | 3.0800 | 3.0720 | 0.997 |
| FZ @ node 1 | 1.3400 | 1.3123 | 0.979 |
| FX @ node 31 | 56.0600 | 55.9803 | 0.999 |
| FY @ node 31 | 14.1900 | 14.3236 | 1.009 |
| FZ @ node31 | 13.9500 | 13.8867 | 0.995 |