This section presents the results for both models used in this problem:
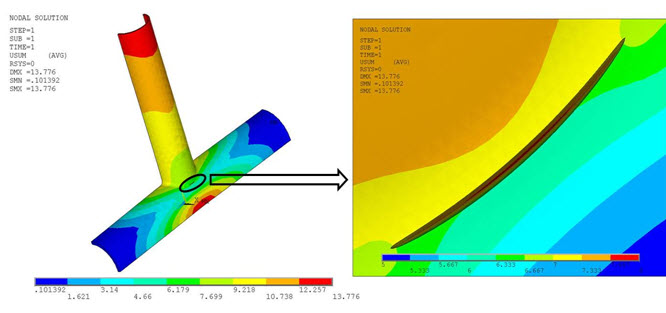
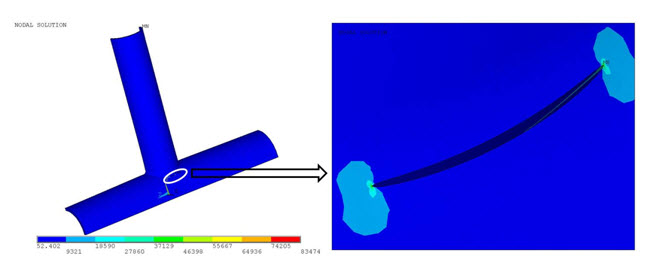
The following two figures show the displacement vector sum (USUM) and the Von Mises Stresses, respectively:
The plot shows the maximum Von Mises stress occurring at the crack tip.
To verify the SIF accuracy obtained via the interaction integral method, the results are compared to analytical results of Newman and Raju and finite-element result of Kamaya. The results agree closely with those obtained in the references.
Because the crack exists at the center of the rectangular block, the results for
half of the crack are therefore plotted in this figure, where normalized SIF =
 :
:
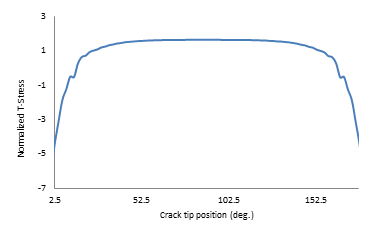
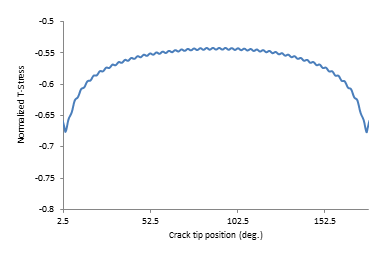
The T-stress results for the semicircular surface flaw are plotted in this figure, where normalized T-stress = T-stress / σo :
The following figures show the displacement vector sum (USUM) and Von Mises Stresses plot of the x-joint pipe with the warped flaw at the welded joint:
The SIFs of the mixed-mode 3D problem with the warped crack surface were compared with those of Rhee.[4] The comparison shows that the normalized KI, KII and KIII results agree well with the reference results near the end points, as shown:
Figure 16.19: Normalized SIFs Results: Comparison with Rhee[4]
![Normalized SIFs Results: Comparison with Rhee[]](graphics/gtecmixmodesif_fig18.gif)
where T is the thickness of the pipe, and the normalized distance is the distance from center of the crack along the crack front divided by half of the crack tip length.
A fine mesh (using meshing bias
(LESIZE,,,,,SPACE)) at the end-point regions
improves the results.
The T-stress results for the X-joint pipe with warped flaw are plotted in this figure, where normalized T-stress = T-stress / σo :