This section presents the results for both crack initiation and crack propagation in the CT specimen:
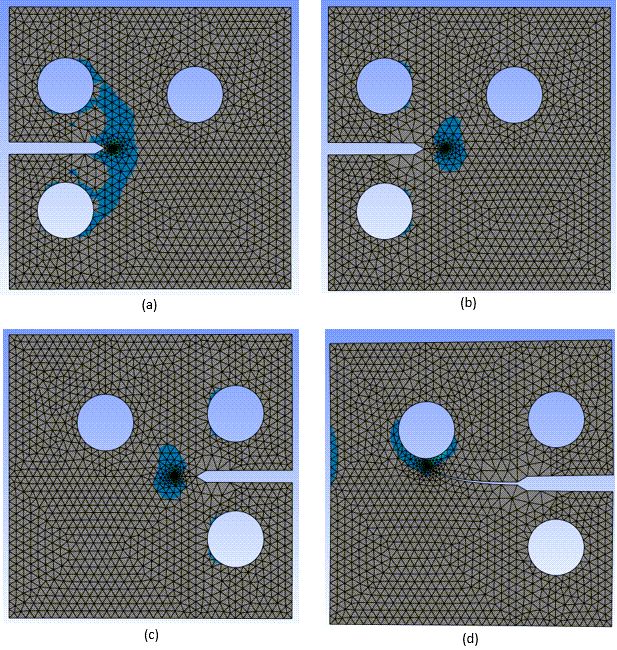
In the following figure, (a) shows the effect of the local mesh adjustment by introducing a trivial load in the first load step:
Compared with the original mesh shown in Figure 70.3: Equivalent Stress and Mesh During Edge-Crack Growth, the mesh around the crack front becomes finer, and the mesh further from the crack front remains nearly unchanged.
As shown by (b) in the figure, the edge crack begins to grow based on the adjusted mesh around the crack, where the mesh is coarser in the upper and lower crack-surface regions. This effect is the result of the commands issued in Standard Settings for Fracture Analysis. The finer mesh moving with the crack front is also shown in (c) and (d).
As shown in (c), the mesh and stress appear from the back, opposite to (b) (front view). Comparing the results at the same moment but in both views shows that the deformation and crack configuration are systematically in the thickness-direction.
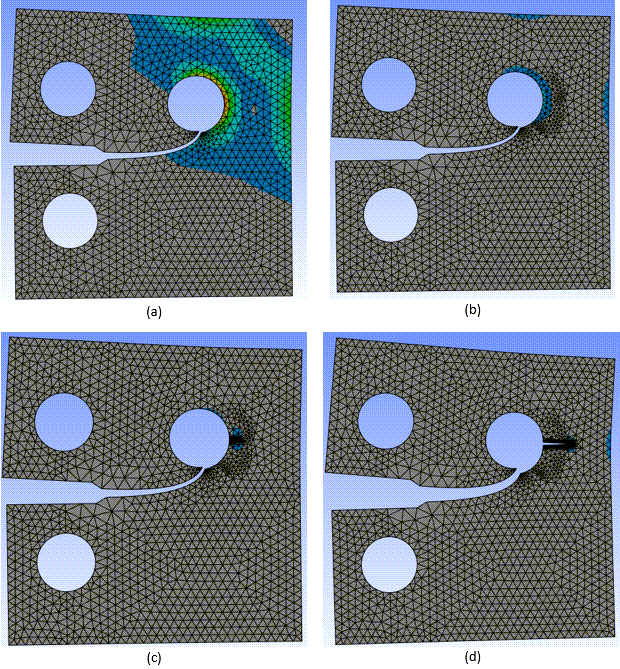
After the edge crack approaches the hole (shown by (d) in Figure 70.3: Equivalent Stress and Mesh During Edge-Crack Growth), it cuts through the hole boundary:
As shown by (b) in the figure, the stress concentration shifts from the crack front to the right wall of the hole. The region of concentrated high stress is set as the initiation zone HOLENCM (via the ADCPI command block in Settings for Crack Initiation and Subsequent Propagation). A crack is initiated there when the maximum principal stress value increases and reaches the critical value. The new crack is located at the center of thickness (b).
As shown by (c) and (d) in the figure, the crack growth touches the front and back free surfaces in the thickness direction and continues to move forward to the right boundary.
In (d), the meshes along crack surfaces are fine, while the counterpart for the edge crack is coarse. This behavior is the result of the moderate coarsening option (MODE) for the edge crack and the conservative (CONS) option for the new crack.
Note: Select the mesh-coarsening option on a case-by-case basis. For example, physical quantities such as pressures and cohesive zone elements are more accurately expressed via a fine mesh on crack surfaces. In cases with free crack surfaces, however, a coarse mesh reduces the total number of elements in the model, generating smaller results files and lowering computational costs and without sacrificing accuracy.
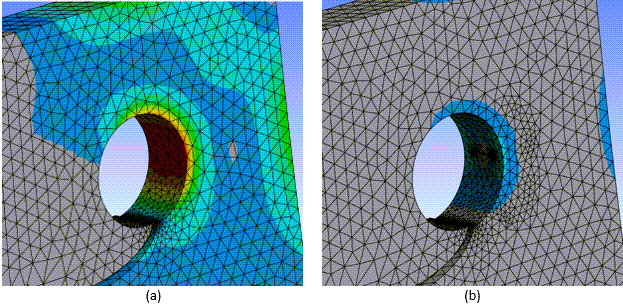
This figure shows the high-stress zone around the hole wall and the initialized crack appearing at the center of the stress-concentration zone (between the front and back surfaces of the CT plate):
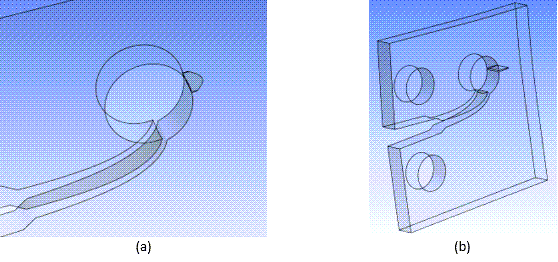
The new crack gradually progresses to the right boundary. This figure shows the evolution of the crack-front shape:
The fracture parameters are the indicators to drive crack-growth directions and growth lengths. Always review their values, even in a successful simulation without any warning or error messages.
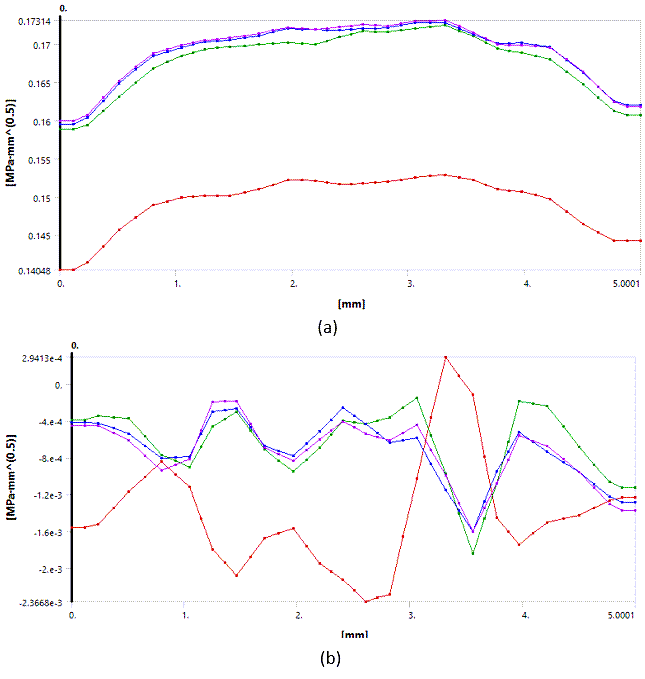
The following figure shows the stress-intensity factors for the edge crack at substep 4 about KI (a) and KII (b):
KI values are approximately 3~4 orders of magnitude larger than KII and are path-independent, implying that the edge-crack growth is mode-I dominated. The results are expected, as the model is symmetrical in the thickness direction.
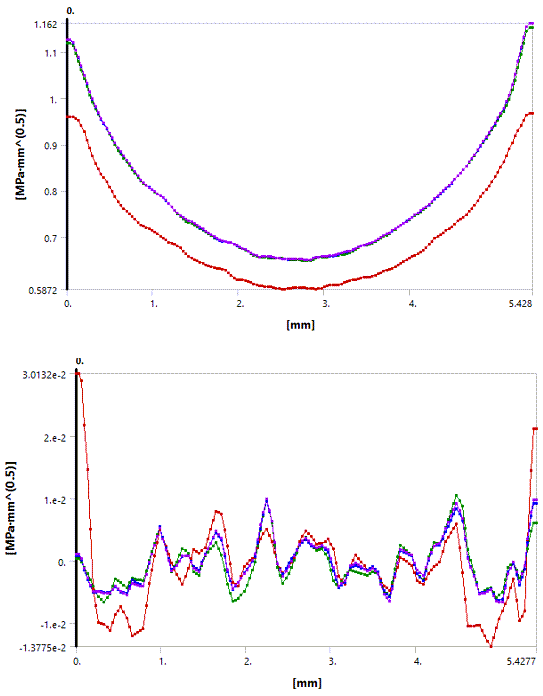
The newly initiated crack is similar. As shown in the following figure, the stress-intensity factors for the new crack at the last substep indicate that this crack growth is also mode-I dominated, and KI values are path-independent.


