Nonlinear material properties are usually tabular data, such as plasticity data (stress-strain curves for different hardening laws), magnetic field data (B-H curves), creep data, swelling data, hyperelastic material data, etc. The first step in defining a nonlinear material property is to activate a data table using the TB command. (See Material Model Interface for the GUI equivalent). For example, TB,BH,2 activates the B-H table for material reference number 2.
To enter the tabular data, issue the TBPT command. For example, the following commands define a B-H curve:
TBPT,DEFI,150,.21
TBPT,DEFI,300,.55
TBPT,DEFI,460,.80
TBPT,DEFI,640,.95
TBPT,DEFI,720,1.0
TBPT,DEFI,890,1.1
TBPT,DEFI,1020,1.15
TBPT,DEFI,1280,1.25
TBPT,DEFI,1900,1.4
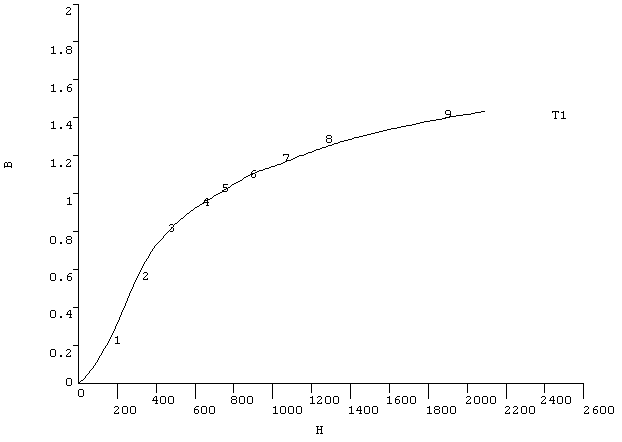
You can verify the data table through displays and listings using the TBPLOT or TBLIST commands.
Figure 2.2: Sample TBPLOT Display shows a sample TBPLOT (of the B-H curve defined above):
For a more detailed discussion of nonlinear materials, see Nonlinear Material Properties in the Material Reference.


