


For a thick solid composite model, the 3D failure analysis shows a more accurate stress state of the structure than a 2D analysis. In this section, you will create and compare the 3D and the 2D Puck failure results on the model.
Follow the steps below to set up ACP (Post):
In Workbench, click ACP (Post) from Component Systems in the Toolbox and drop it onto ACP (Pre).
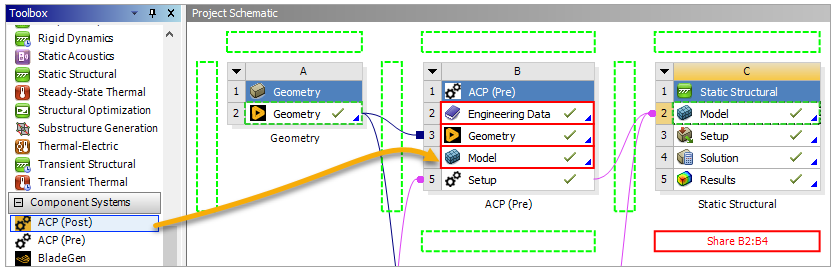
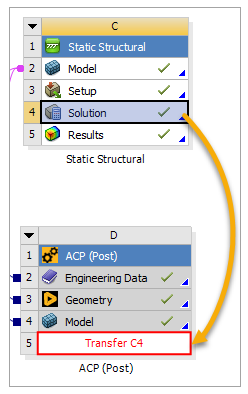
Click the C4 Solution cell and drop it onto the D5 Results cell to connect the two cells.
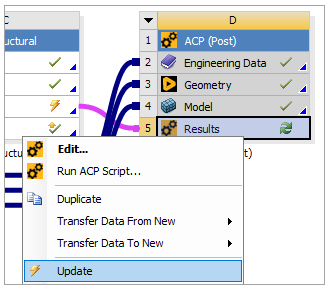
Right-click the Results cell in the ACP (Post) system and select Update to finish transferring data from ACP (Pre) and Static Structural.
In this section, you will evaluate both 3D and 2D Puck Failure criteria. It is good practice to use multiple failure criteria for your results since some are only applied to certain materials (see Failure Criteria vs. Ply Type Table in the ACP User's Guide).
Double-click Results to open ACP (Post).
In the Tree View, right-click Definitions and select Create Failure Criteria.
In the Failure Criteria Definition dialog, change the Name to
FailureCriteria_Puck3D(A, below). Enable Puck, then click Configure (B).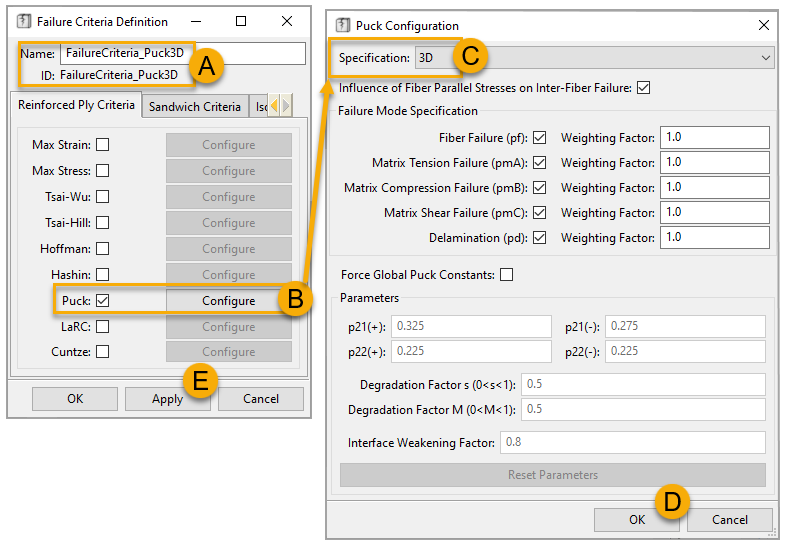
Note: For more information about Puck failure criteria, see Puck Failure Criteria in the ACP User's Guide.
In the Puck Configuration dialog, select 3D from the Specification drop-down menu (C, above), then click OK (D) to close the dialog. Click Apply (E) in the Failure Criteria Definition dialog to finish creating the Puck 3D failure criteria.
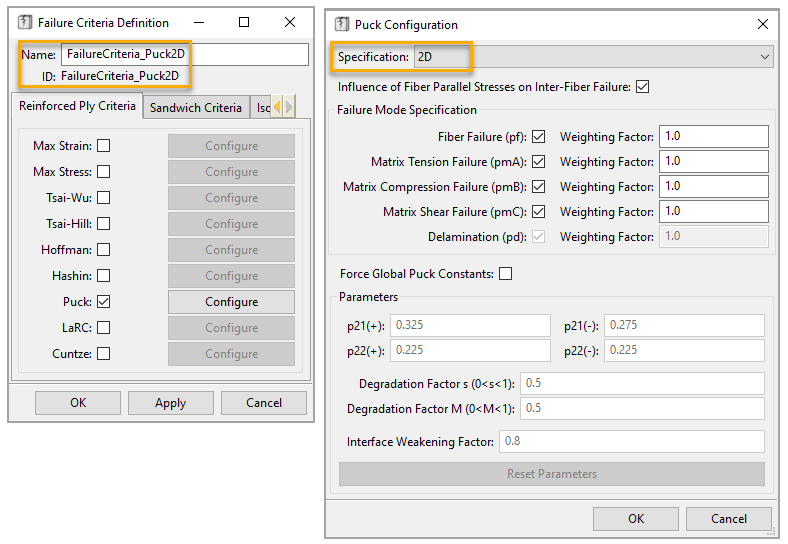
Define the Puck 2D failure criteria following steps 2 to 4 above and using the specifications shown below.
Note: You can apply any Reinforced Ply Criteria shown above in 3D analysis and evaluate them at the same time.
In the Tree View, expand Solutions, then right-click Solution 1 and select Create Failure Plot.

In the Failure dialog, change the Name to
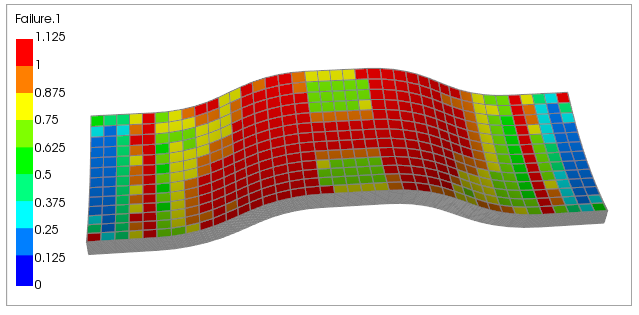
Failure_Puck3D(A, below). Deselect Entire Model (B), then place the cursor in the Data Scope field (C) and select All_Elements from Element Sets in the Tree View.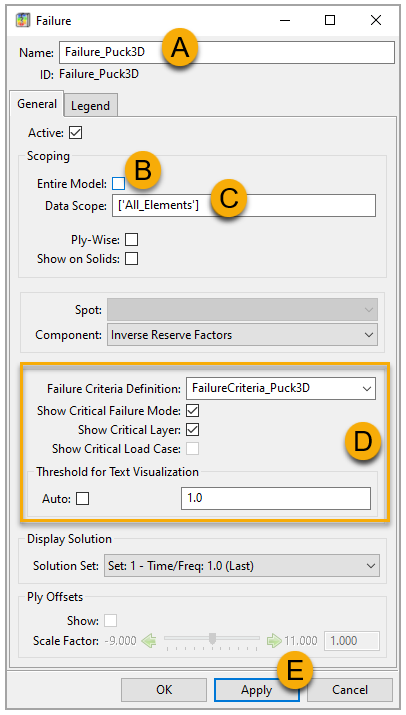
In the Failure Criteria Definition, select FailureCriteria_Puck3D from the drop-down, then specify the other properties as shown in the image (D, above). Click Apply (E), then close the dialog. The 3D failure plot is now visible in your model:
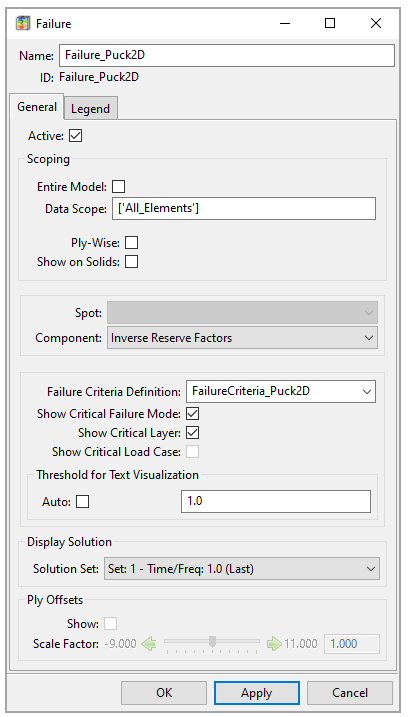
Define the 2D failure plot following steps 6 to 8 above and using the specifications as shown in the image below.
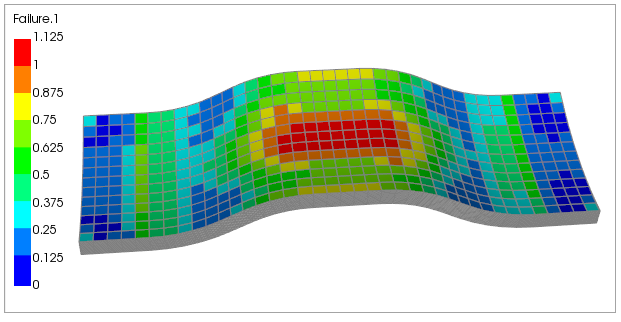
The 2D failure plot is shown in your model. Compare this with the 3D plot above to see the differences.
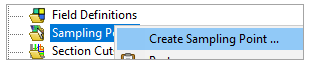
In the Tree View, right-click Sampling Points and select Create Sampling Point.
In the Sampling Point Properties, define the coordinates of Sampling Point as
(22.4076,3.2309,12.7004)(A, below) and Sampling Direction as(0.5000,-0.8660,0.0000)(B).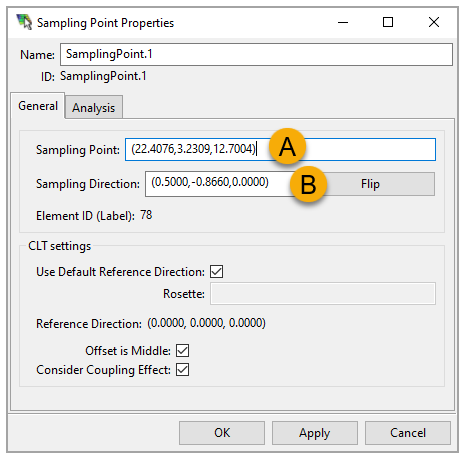
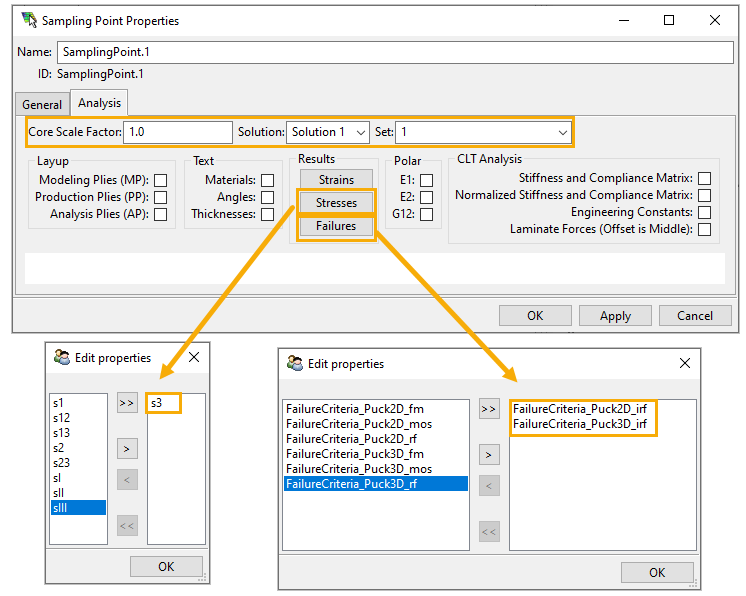
Switch to the Analysis tab, then define the properties as shown in the image below.
Click Apply to visualize the stress and failure results. Analyze the stresses and the differences in the 3D and 2D failure results.
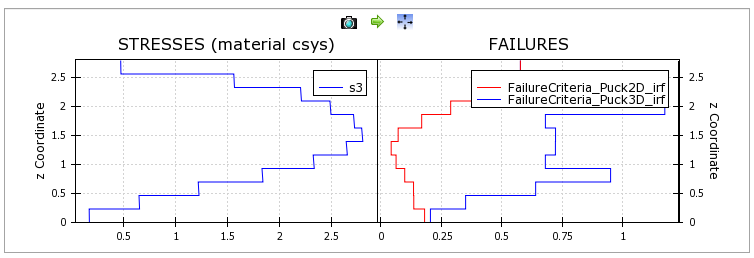
Note:Given the doubly curved shape and part thickness, the off-plane stress s3 is significant.
The 2D failure criterion does not take the off-plane stress s3 into account.