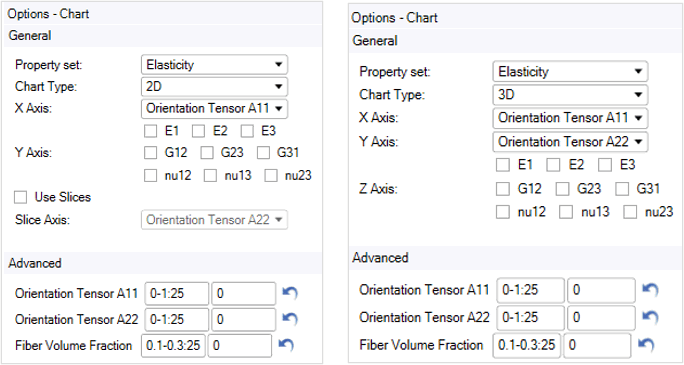
You can create charts of the generated variable material properties. To so, right-click Variable Material Evaluation in the outline window and select Add Chart. This adds a node in the outline and shows the following options:
First, choose the Property Set you want to plot. Depending on the Chart Type, the following tool options are then available.
For 2D Charts (line charts), you can specify the following options:
X Axis: Select a parameter.
Y Axis: Select the material properties you wish to plot.
Use Slices: Activate an additional input parameter on the slice axis. This allows you to plot multiple lines for different values of the fixed parameters. See Figure 2.34: Chart example 1 below for an example.
Slice Axis: Select a parameter.
For 3D Charts (surface charts):
X Axis: Select a parameter
Y Axis: Select a parameter
Z Axis: Select the material properties you wish to plot
Once your parameters and material properties are selected, you can use the advanced options to control the parameter points where the material properties are evaluated. For each parameter you can specify:
The values at which the selected material properties are evaluated when the parameter is active– that is, when it is used as an axis. By default, 25 equally spaced points within the parameter variation range are used. You can specify either a comma separated list of values or n evenly spaced values in the range [a,b] using the format a-b:n.
The value assigned to the parameter when it is not active. If available, this value is set equal to the default selected in the Generated Material. Otherwise, it is set to 0.
You can click the ![]() icon to reset these values to the
default ones.
icon to reset these values to the
default ones.
The material properties for the line and surface plot are computed using interpolation with the options specified in the Generated Material.
When a Short Fiber Composite Model is selected, you can additionally specify the following option for 3D Charts or 2D Charts using Slices:
| Restrict to the orientation tensor space: If the parameters Orientation Tensor A11 and Orientation Tensor A22 are selected, you can activate this option to restrict the parameter values to the triangular region as shown in the diagram above. Also, see Figure 2.37: Chart example 4 below. |
Note: When this option is active, the values of the parameters Orientation Tensor A11 and Orientation Tensor A22 need to be the same for 3D Charts.
Click Complete to open a new window tab with the chart.


