Figure 2.34: Chart example 1: An example of a 2D Chart using the Slice Axis. All the computed data points are shown, and you can inspect the corresponding parameter values by hovering over them.
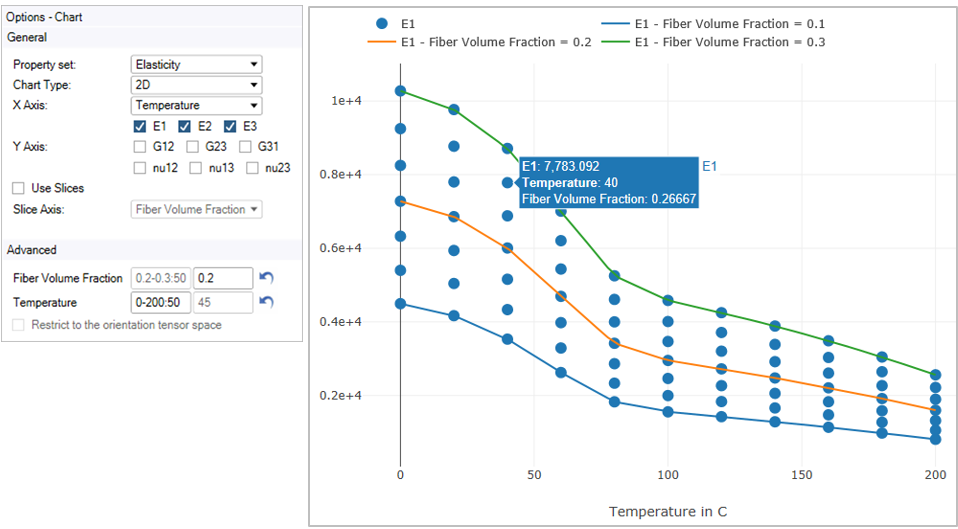
Figure 2.35: Chart example 2: Below is an example of a 2D Chart comparing the Young's moduli as functions of the Temperature (evaluated at 50 equally spaced points in the interval [0, 200]) with the Fiber Volume Fraction value held fixed at 0.2. Here, the data points are not shown. In general, you can hide or show a variable by clicking the corresponding legend entry.
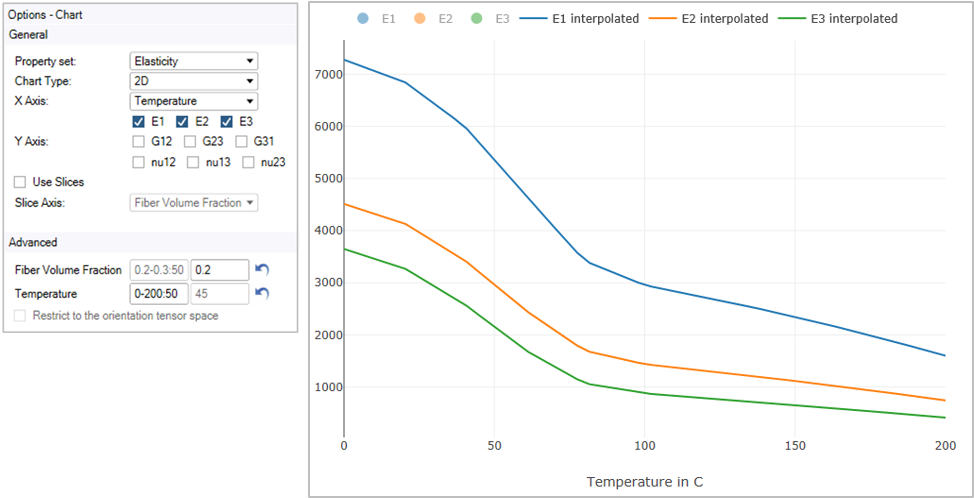
Figure 2.36: Chart example 3: The 3D counterpart of Figure 2.34: Chart example 1.
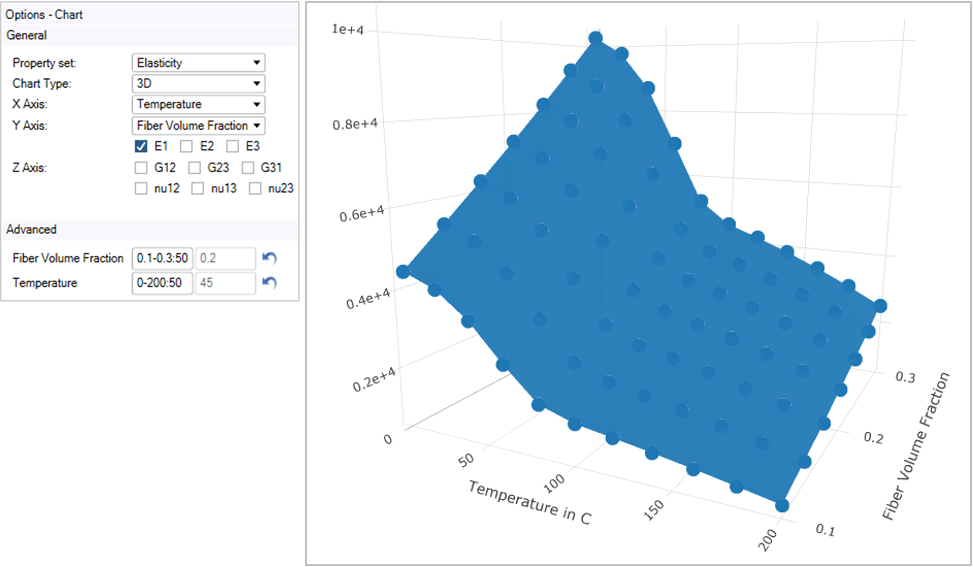
Figure 2.37: Chart example 4: A 3D Chart showing the Young modulus E1 of a Short Fiber Composite model using the option Restrict to the orientation tensor space.
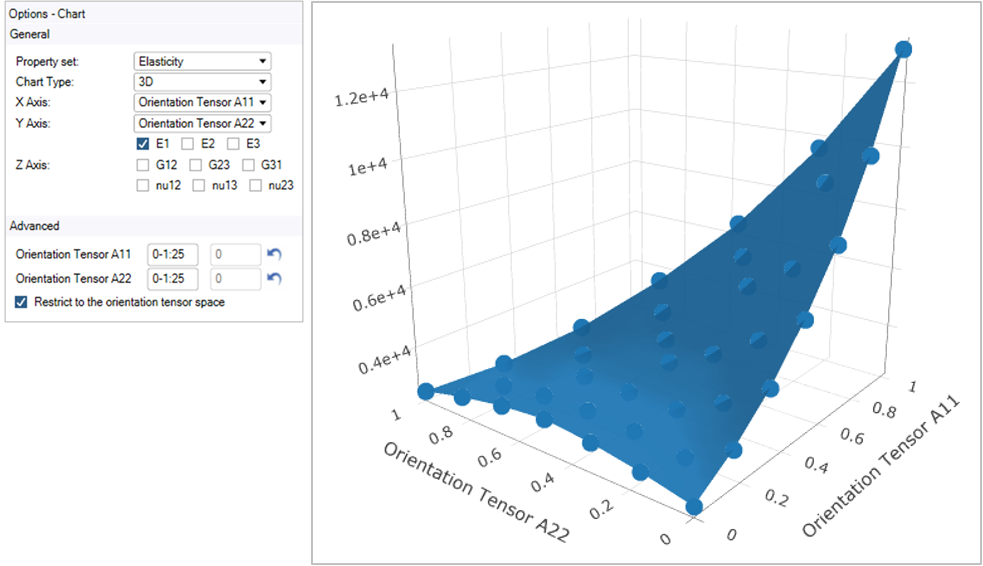
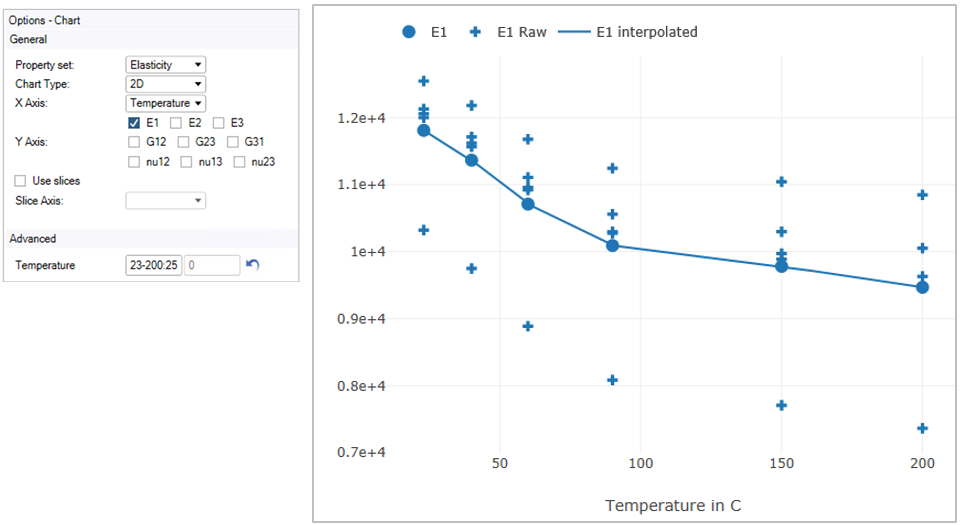
Figure 2.38: Chart Example 5: For randomized RVEs, you can also visualize the raw variable results. Note that exluded raw results are not shown.