


Displaying Order Levels in a Graph
This section enables you to get a more detailed view of the dominant orders. You can compare several orders using evolution vs. time, or evolution vs. RPM. and create datasets for Car Sound Simulator.
Note:
To change the maximal order display in this graph, change the value of the
field Highest order for order view in . For more information on order analysis preferences, see General Settings.
Note: Order export is only possible from Time/order or RPM/order representations.
To Display Order Levels in Graph:
-
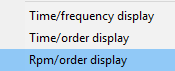
Right-click the representation then choose Rpm/Order or Time/order
display.
-
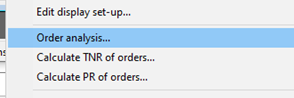
Right-click the representation then choose Order analysis...
The order levels curves are displayed in a time-domain window.
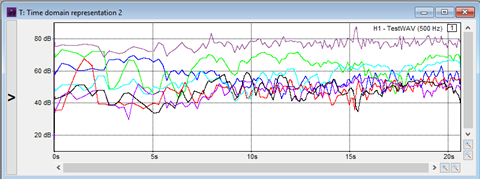
The order levels are displayed in the original linear unit of the temporal signal versus time. When the original unit of the temporal signal is Pa, the order levels may be displayed in Pa vs. time, dB SPL vs. time, or dB(A) vs. time. See Changing the Ordinate Unit of the Order Levels Graph. When the initial signal's unit is not Pa, the display unit cannot be changed from the signal's original unit.
Tip:
To switch scale to RPM abscissa, right-click the order level graph then
select Rpm/level display.