


Setting a Measure
What is a Measure?
A Measure is the formula of measure calculation to determine the numerical value of the physical quantity, the notion or the function selected.
How to set a Measure?
Setting one measure to an area
Select the area to measure.
From the Measure list, select the measure to set.
Setting several measures to an area
Select the Measure cell of the area for which to add another measure.
Click Add area or measure
 .
. From the Measure list, select the measure to set.
What are the measures available?
The topic considers photometric units and maps. If you make radiometric analysis, the units and maps correspondence are:
Unit |
Map |
|||
|---|---|---|---|---|
Photometric |
Radiometric |
Photometric |
Radiometric |
|
lx |
W.m-2 |
Illuminance |
Irradiance |
|
cd |
W.sr-1 |
Intensity |
Intensity |
|
cd.m-2 |
W.sr-1.m-2 |
Luminance |
Radiance |
|
lm |
W |
|||
The topic presents the different formula of measure calculation considering the following variables:
N = number pixels in the measurement area.
V = value of a pixel.
W = pixel weight.
Pixels on the edges of the measurement area can be partially integrated in the area, hence the formula considers the pixel weight to calculate the selected measure of the pixel part integrated in the area.
Maximum and Minimum
Maximum and Minimum correspond to the Maximum or Minimum of the selected magnitude in the measurement area defined.
These thresholds are used to exclude values in the map (below the Minimum and/or over the Maximum).
It can be useful to ignore black pixels for example. If some pixels are not lit, they introduce a bias into the measurement. A minimum or maximum threshold then allows you to ignore these values.
Average
Average corresponds to the average value of the selected magnitude in the measurement area defined.

Area
To display an area value:
Make sure the shape is a rectangle, an ellipse or a polygon.
In the Magnitude column, select Dimension.
The Measure turns into Area and its value is displayed in the Value column.
Flux or Integral
The flux or integral of the measurement area defined is measured thanks to the following formula:
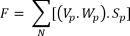
F (flux) corresponds to the luminous flux in lumen (lm) for an illuminance map.
F (integral) corresponds to the luminous intensity in candela (cd) for a luminance or intensity map.
S = surface (m²) of one pixel for a luminance or illuminance map, or a pixel solid angle in steradian (sr) for an intensity map.
Barycenter X and Barycenter Y
Barycenter X and Barycenter Y correspond to the X and Y coordinates of the barycenter of the measured magnitude in the measurement area defined.
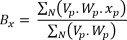
x (or y) = pixel coordinates on the x or y axis.
Sigma
Sigma corresponds to the standard deviation of the measured magnitude.
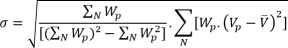
 = average of the magnitude
of the measurement area defined.
= average of the magnitude
of the measurement area defined.
Sigma X and Sigma Y
Sigma X and Sigma Y correspond to the standard deviation according to the barycenter, that is to say the spread on the x and y axes (or on theta and phi).
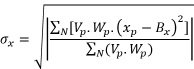
x (or y) = pixel position on the x or y axis.
B = Barycenter X or Barycenter Y.
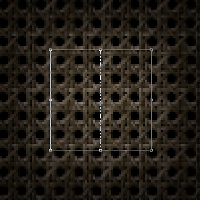
Contrast
Contrast corresponds to the scale difference between the maximum and minimum magnitude of the result.
Contrast is generally used to measure the quality of an optical system.
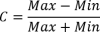
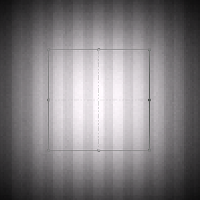 Contrast = 0,58 |
 Contrast = 1 |
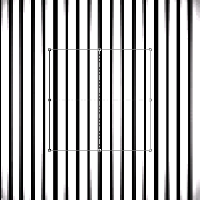
RMS Contrast
RMS (Root Mean Square) Contrast corresponds to the standard deviation of the magnitude measured divided by the average value of the magnitude.
RMS Contrast can be used to measure the noise in the result.

σ = standard deviation of the measured magnitude.
- = average of the magnitude
of the measurement area defined.
RMS Contrast = 0,39
RMS Contrast= 0,87
The higher the RMS Contrast, the lower the noise.
Range, Range X, Range Y, Range Theta, Range Phi
Range corresponds to the distance or angle between Point 1 and Intersection point.
The Intersection point corresponds to the point for which the threshold (iso level) defined is the closest from Point 2.
Range X, Range Y, Range Theta and Range Phi correspond to the coordinates of the Intersection point.
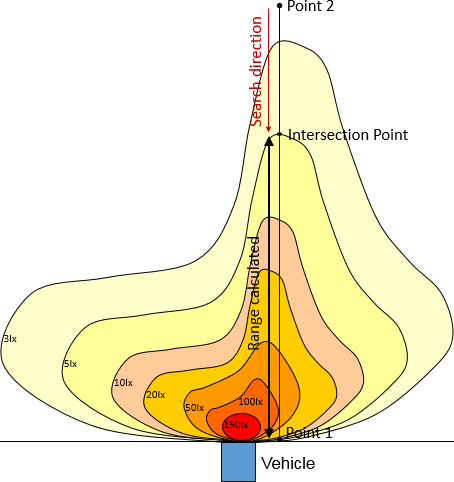
Example of range calculation in an illuminance map with Iso level = 5lx.
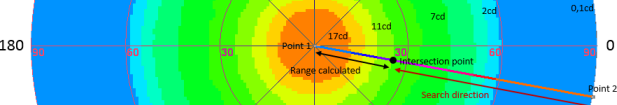 Example of range calculation in an intensity map with Iso level = 11cd. |
UGR CIE 117-1995
The UGR calculation formula is:
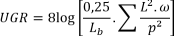
Refer to UGR Overview for more detailed information.
Eye Illuminance
Eye illuminance is the illuminance at the map's observer point due to the light of the map enclosed in the surface tool.
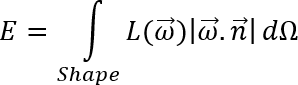
 = map normal and virtual eye
illuminance sensor's normal.
= map normal and virtual eye
illuminance sensor's normal.  = one direction in the
solid angle domain defined by the viewer's surface tool.
= one direction in the
solid angle domain defined by the viewer's surface tool.  = map luminance in the
direction.
= map luminance in the
direction.  = elementary solid angle associated with
the direction.
= elementary solid angle associated with
the direction.