Fields of View
This page describes the Fields of View result, obtained from a LiDAR simulation and helps you understand how the grid sampling can impact result visualization.
Field of View
You can edit the visualization of the LiDAR Projected Grids.
You can export the projected grids as geometry to convert them into construction lines.
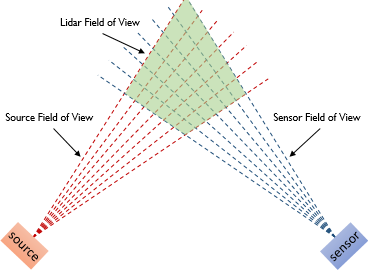
- The Source Field of View represents the illuminated area.
- The Sensor Field of View represents the area observed by the sensor.
- The LiDAR Field of View is the overlap of the Source and Sensor Fields of View.
Grid Sampling
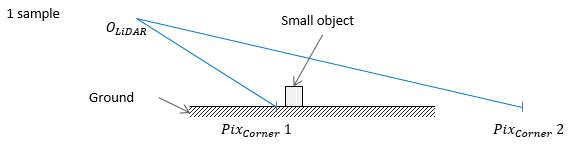
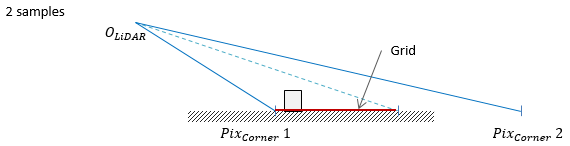
The quality of the projected grid depends on the source and sensor sampling. With an approximate sampling, you may miss some thin geometries or get an inaccurate grid on geometries' edges.
Sensor Grid Sampling
Below are examples of the level of accuracy obtained depending on the sampling precision.
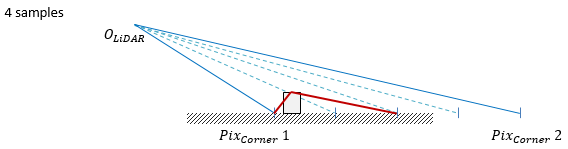
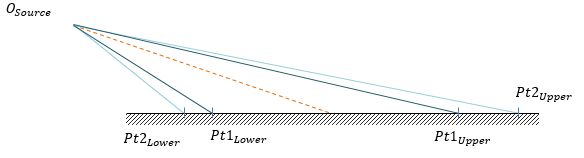
Source Grid Sampling
The shape of the source grid can be impacted by its sampling.
To project the source, samples are taken at different positions with a regular step. A high number of samples improves the accuracy and reduces the risk of error.
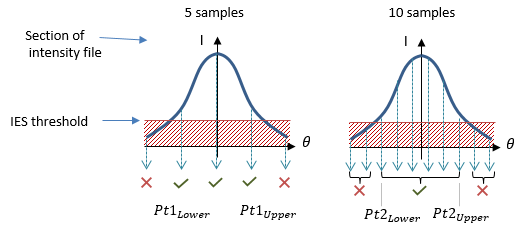
Depending on the sampling and shape of the intensity, this difference can be noticeable on the projected grid results.