Selecting a Near-Field Quantity to Plot
When plotting near-field quantities, the quantity can be a value that was calculated by HFSS, a value from a calculated expression, or an intrinsic (inherent) variable value such as frequency or theta.
Prerequisites
For the Near Field Report icons to appear on the ribbon, or for the Create Near Field Reports command to appear on the Results menus, the design must contain radiation boundaries, PMLs or Hybrid regions, and must contain a Near Field Setup for sphere, line or rectangle.
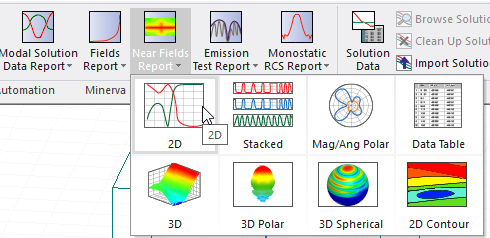
To select a near-field quantity to plot:
- When you create the report, use the Results tab of the ribbon and select the Near Fields Report icon to select from the available report types, or if you use the Results menus, select Create Near Fields Report and select the plot type from the menu.
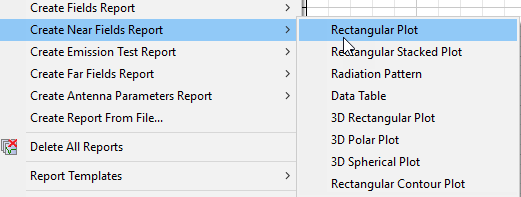
The Report dialog appears.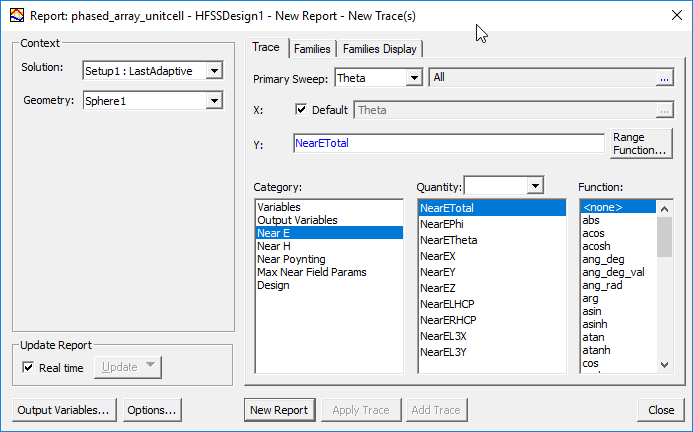
When you create a Near Field Rectangular Contour plot, if the Context Geometry is a Rectangle radiation setup and the Primary and Secondary sweep is the combination of _u and _v, then the plot creation dialog is as follows.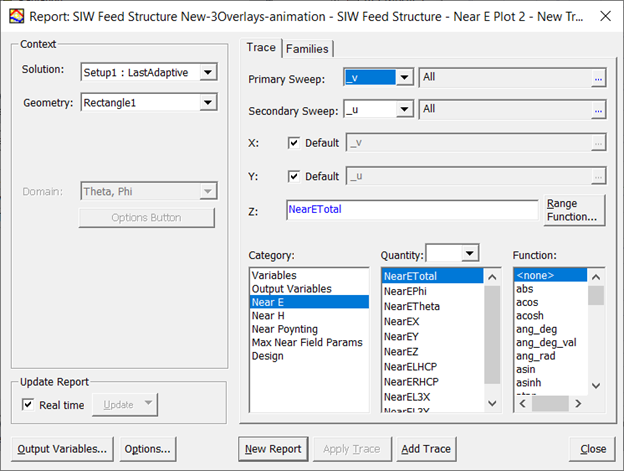
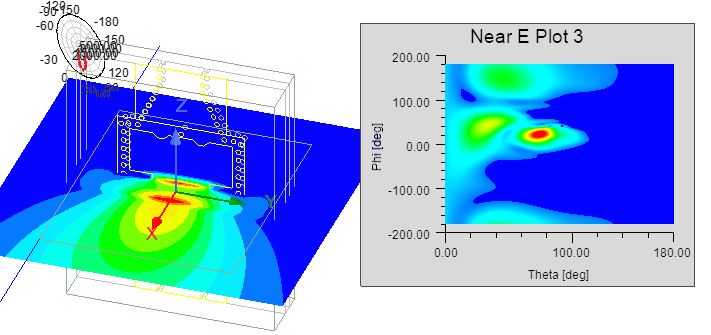
This kind of near field rectangular contour plot can be overlayed in its actual defined rectangle in 3D space in the Modeler window. - In the Geometry portion, select a predefined Sphere, Rectangle or Line. The geometry selected affects where the plot data is selected and if, where and how the plot will be overlayed on the model, if you choose to do so, after the plot is created. In the following figure, the Near E Polar plot overlayed on the model uses Sphere1 as the Geometry and that geometry uses the Global CS.
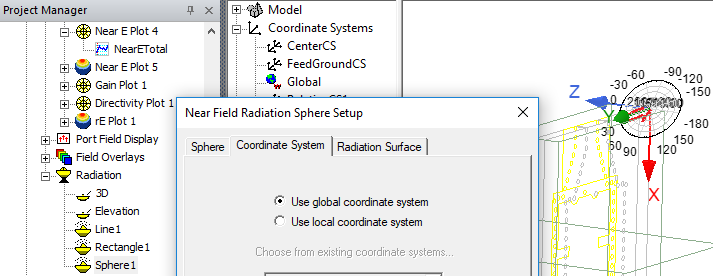
In the following case, Near E Plot 2 Uses Rectangle1, which uses RelativeCS1.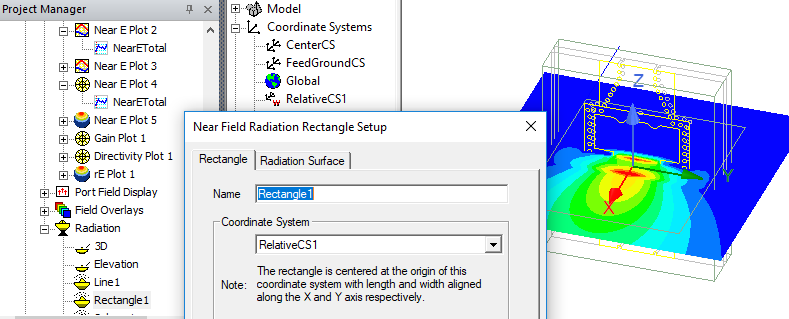
In the case of a plot generated on a line, a plot can be created but not overlaid.
In the case of a 2D Contour Near Field Plot generated on a Sphere, the plot can be overlaid as a plot in the upper right of the model window.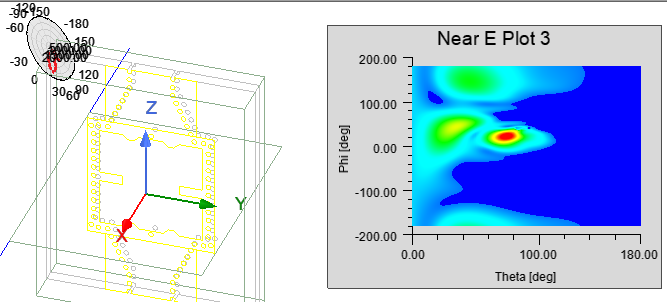
- In the Report
dialog box, select one of the following categories. The selected category provides the default name of the report.
Variables
Intrinsic variables, such as frequency or theta, or user-defined project variables, such as the length of a quarter-wave transformer.
Output Variables
User defined expressions applied to derive quantities from the original field solution.
Near E
The radiated electric field in the near field region.
Near H The radiated H field in the near region Near Poynting The Poynting field in the near region. This is 0.5 * E *conj(H). Max Near Field Params
The maximum radiated electric field in the near region.
Near Normalized Antenna
The resultant plot is: field quantity / (maximum field quantity value over the entire infinite sphere).
- If you selected the Near E category, specify the polarization
of the electric field by selecting one of the following types of quantities
from the Quantity list. The corresponding options appear for Near H and Near Poynting. If you select Max Near Field Params, there are additional Quantities for E, H and Poynting.
NearETotal
The combined magnitude of the electric field components.
NearEPhi
The phi component of the electric field.
NearETheta
The theta component of the electric field.
NearEX
The x-component of the electric field.
NearEY
The y-component of the electric field.
NearEZ
The z-component of the electric field.
NearELHCP
The dominant component for a left-hand, circularly polarized electric field.
NearERHCP
The dominant component for a right-hand, circularly polarized electric field.
NearECircularLHCP
The polarization ratio for a predominantly left-hand, circularly polarized antenna.
NearECircularRHCP
The polarization ratio for a predominantly right-hand, circularly polarized antenna.
NearEL3X
The dominant component for an x-polarized aperture using Ludwig's third definition of cross polarization.
NearEL3Y
The dominant component for a y-polarized aperture using Ludwig's third definition of cross polarization.
If a Near-field plot takes a long time to plot, be sure to perform File>Save when the plot is displayed. This saves the calculated data and permits fast display on subsequent viewings of the plot.
Reports appear under Results, and can be opened as reports. 3D Reports can be overlayed on the model, based on the selected geometry. 2D Near Field Reports on Rectangles can be overlayed as 2D plots.
Overlaying Near Field Reports
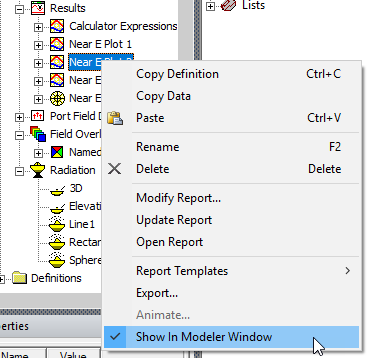
Depending on the geometry selection and type of plot, some near field plots be shown in the model window. If a plot is appropriate for this purpose, the Show in Modeler Window option appears on the Project window short cut menu.
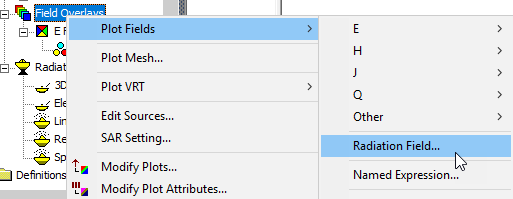
You can also see these plots listed by right clicking on Field Overlays in the Project tree and selecting Plot Fields>Radiation Field.
This displays the Overlay radiation field dialog box. Notice that it lists Results plots that can be overlayed, and not those listed under Field Overlays.
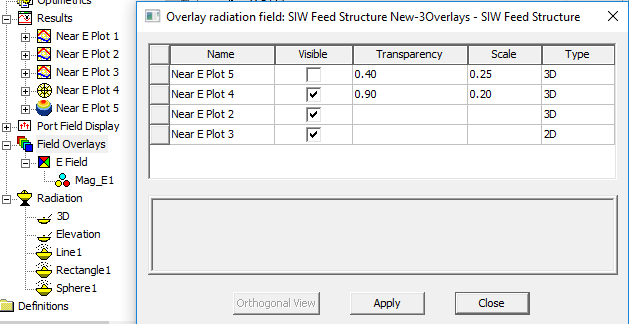
You can display multiple kinds of Plot overlays and Field Overlays at the same time.
