Plotting the Mesh
Before or after the solution is complete, you can plot the finite element mesh on surfaces or within 3D objects. For an HFSS design that includes Layout Components, you can also select nets and layers from the layout components to plot.
- Select one or more surfaces or objects to create the mesh plot on or within. If the design is HFSS and includes Layout Components, you can select the surfaces either before or after selecting Plot Mesh.
- Select Plot Mesh in one of two ways:
- Click
- In the Project Manager, right-click Field Overlays and select Plot Mesh...
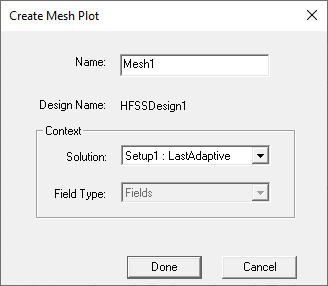
The Create Mesh Plot dialog box appears.
If the HFSS design includes Layout Components, the Create Mesh Plot dialog includes a table of Nets and Layers from which you can make selections.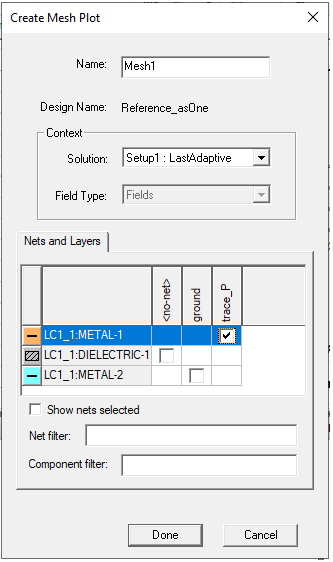
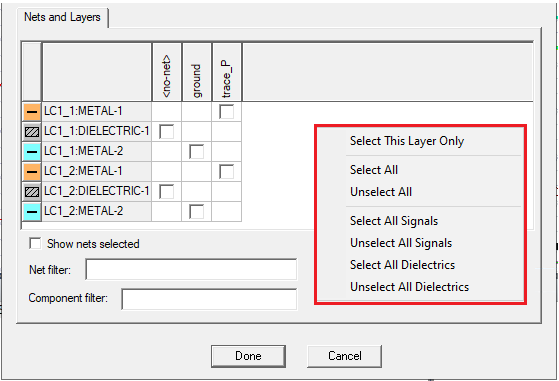
This Nets and Layers section displays all the layers and nets of every layout component in the design. Upon opening, it adjusts its size to try to show all the rows and columns for the layout components. You can resize the parent dialog. For objects in the component belonging to a specific layer and net, you can select a checkbox. By clicking the column headers, you can select or un-select checkboxes for an entire column. You can toggle the “Show nets selected” checkbox to move all the selected nets to the left side of the table. You can use the Net filter and Component filter fields to filter out specific nets and components. The net and component filters support ‘*’ and ‘?’ wildcards and you can delimit multiple filters with commas. The Nets and Layers table is refreshed each time you update the filter text.If you right click on the Nets and Layers panel, a short-cut menu appears that lets you Select This Layer Only, Select or Unselect All, Select or Unselect All Signals, or Select and Unselect All Dielectrics.
- Click
- Select the Solution to use from the drop-down menu.
For HFSS designs that include layout components, see a discussion with example below.
- If Field Type is enabled, you can select from the drop-down menu for a mesh plot.
- Click Done.
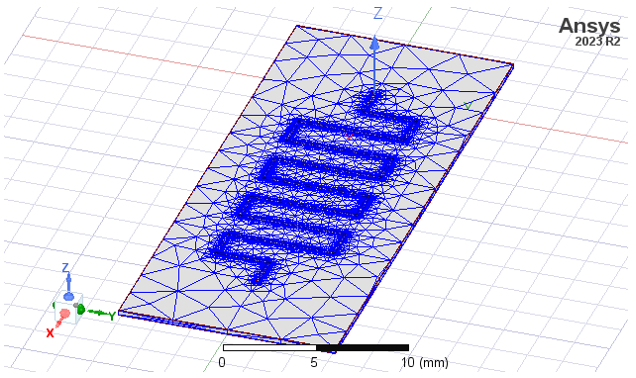
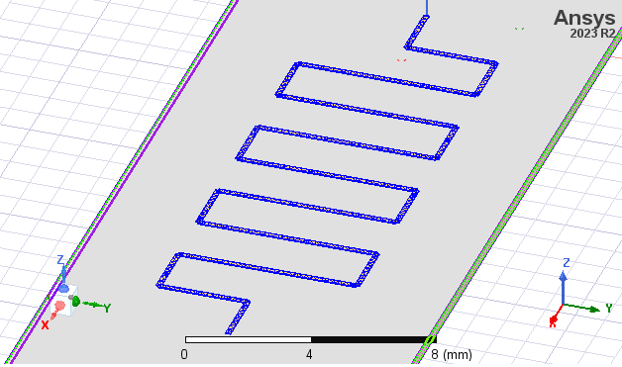
The mesh appears on the surface or object you selected. For example:
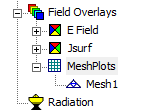
An icon for the mesh also appears in the Project Manager under Field Overlays> Mesh Plots.
If a solution is ongoing, you can select the Mesh Plots icon in the in the Project Tree, right-click to display the shortcut menu, and select Update Plots. This updates the mesh plot to include the latest data available. After the last adaptive pass, the mesh plot is automatically updated.
If a mesh includes seeding, these effects appear at the start of the adaptive passes. Any mesh adaptation at the start of a subsequent pass is not plotted until after that pass is completed. This delay ensures that mesh plots and actual solutions remain consistent with each other.
You can modify an existing plot by selecting the plot and changing the properties.
If you modify the geometry of an object, the solution is invalidated and the mesh plot is removed.
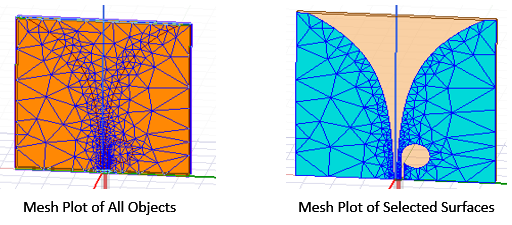
If you have plotted the mesh of a Solve-Inside object, you can view the internal mesh by using either the clip-plane feature or the Model Analysis dialog box.
Also see the discussion here, under Visualization for Skin Depth Refinement Mesh Results. The same techniques for visualization for internal mesh plots apply even if seeding is not used.
Example of Mesh Plots for an HFSS Design with Layout Components
First, solve the design. You can either select geometries in the Modeler window before opening the Create Mesh Plot dialog, or use the Nets and Layers area in the Create Mesh Plot dialog to select objects from the layout components to plot. These objects are represented as combinations of nets and layers and can be selected by checking the corresponding checkboxes.
This Nets and Layers section displays all the layers and nets of every layout component in the design. Upon opening, it adjusts its size to try to show all the rows and columns for the layout components. You can resize the parent dialog. For objects in the component belonging to a specific layer and net, you can select a checkbox. By clicking the column headers, you can select or un-select checkboxes for an entire column. You can toggle the “Show nets selected” checkbox to move all the selected nets to the left side of the table. You can use the Net filter and Component filter fields to filter out specific nets and components. The net and component filters support ‘*’ and ‘?’ wildcards and you can delimit multiple filters with commas. The Nets and Layers table is refreshed each time you update the filter text.
If you right click on the Nets and Layers panel, a short-cut menu appears that lets you Select This Layer Only, Select or Unselect All, Select or Unselect All Signals, or Select and Unselect All Dielectrics.
After making selections click Done. The mesh plot will be generated on the objects belonging to the selected layer/net combinations.
If you want to to re-assign a mesh or field plot, either select 3D geometries from layout components in the modeler window before selecting Reassign in the right-click menu, or select Reassign.
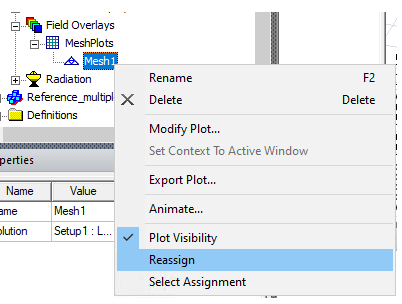
For HFSS designs with layout components, the Select Layout Component Geometry dialog appears. This has the same functionality and menus as the this Nets and Layers section of the Create Mesh Plot dialog.
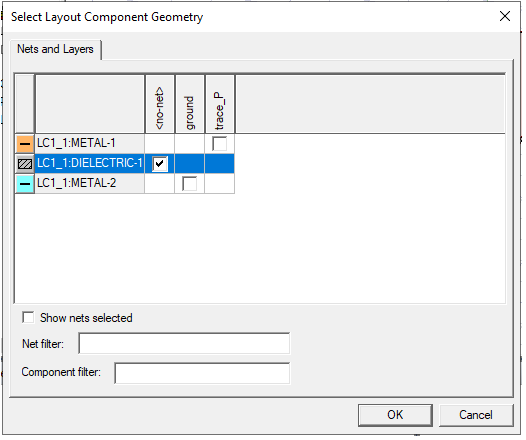
Change the selection in the dialog and click OK. The mesh plot will be re-assigned to the newly selected objects, in addition to any 3D geometries previously selected from the modeler window. If you click cancel, the plot is only re-assigned on 3D geometries previously selected. If there are no previously selected 3D geometries, the program issues an error message. Change the selection in the dialog and click OK to display the reassigned mesh plot.