


Use the Monitoring page to view messages coming from:
Job Management Service. Stores and manages jobs and job data.
Evaluators. Agents running on compute resources which pull and run simulation tasks.
Autoscaling Service. Enables autoscaling agents to launch the required number of evaluators to meet the demand of different workloads.
Resource Management Service. Registers evaluators, making associated compute resources available for work.
File Gateway. The REST gateway for accessing and interacting with job files.
If you do not see this page in the navigation pane, you must enable it.
The Monitoring page has six tabs. On these tabs, new messages are continuously added to the bottom of the message pane.
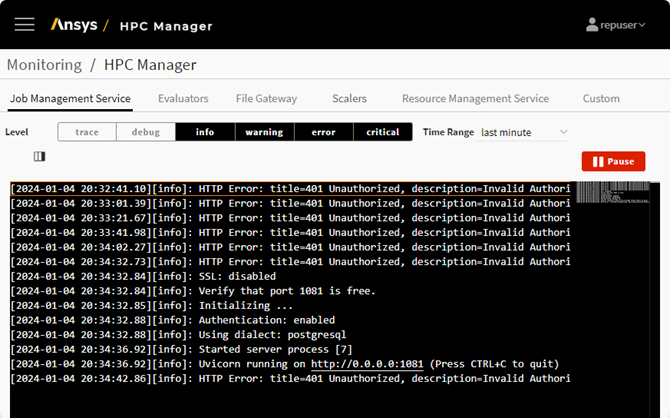
Select Logging Levels
To limit the types of messages that are shown or display additional types of messages, use the Level filters above the message pane. By default, all but trace and debug messages are shown.

Each filter represents a specific logging level:
- trace
Details about the execution of an application's code, which can provide context to understand the steps leading up to errors and warnings.
- debug
A more verbose logging level with detailed information about all event types that be helpful in diagnosing IT issues.
- info
Information relevant to the general running and management of the system, where things are working as expected.
- warning
Information about less serious problems that did not result in an unrecoverable error.
- error
Runtime errors or unexpected conditions, where software has not been able to perform some function.
- critical
Severe issues such as hardware failure.
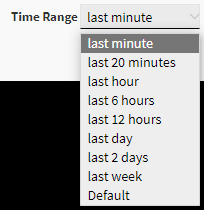
Select a Time Range
By default, message received within the last minute are displayed. To view metrics for a different time period, make a selection from the Time Range drop-down.
Display/Hide Tags in Messages
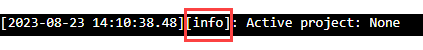
By default, the logging level type is indicated after the timestamp for each message displayed in the log:
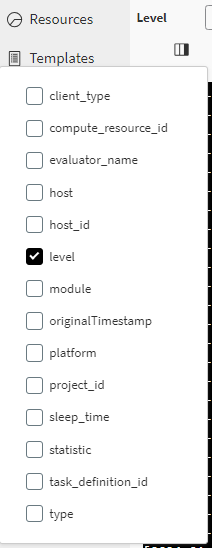
Additional tags can be included in the display of messages to provide more detail about a message. For example, when viewing messages from evaluators, you might want to include the evaluator name so that you know which evaluator is associated with each message.

To control the visibility of tags in logging messages:
Click
 above the message
window.
above the message
window.Enable the tags that you want to see in logs, and disable tags that you do not want to see.
Pause and Resume Messaging
To temporarily pause the display of new messages, click above the message pane. You must do this if you want to be able to download the log.
To resume the display of new messages, click .
Navigate the Message Pane
Because new messages are continuously added to the bottom of the message pane, you can use the miniaturized log on the right side of the message pane to quickly scroll to a particular location in the pane.
A standard scrollbar is also available on the right edge of the message pane.