This section discusses the results for both models:
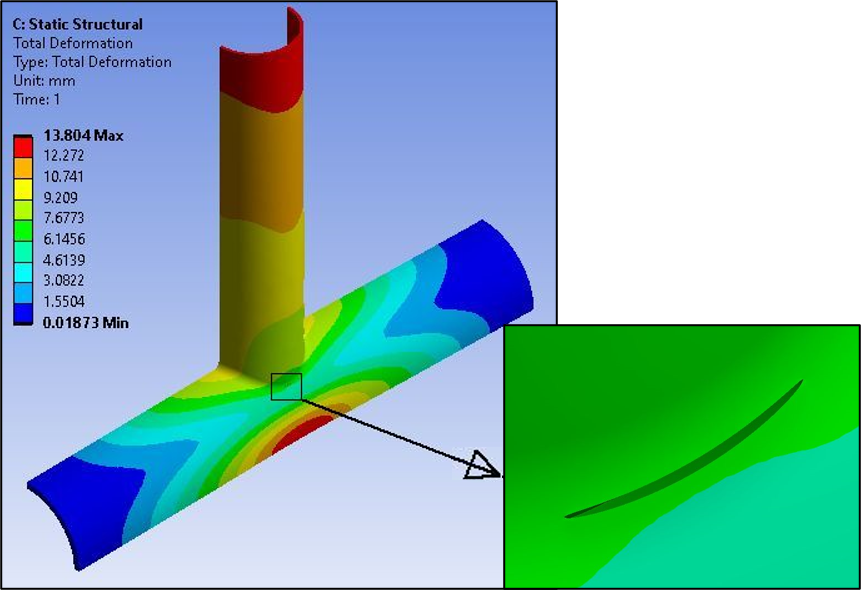
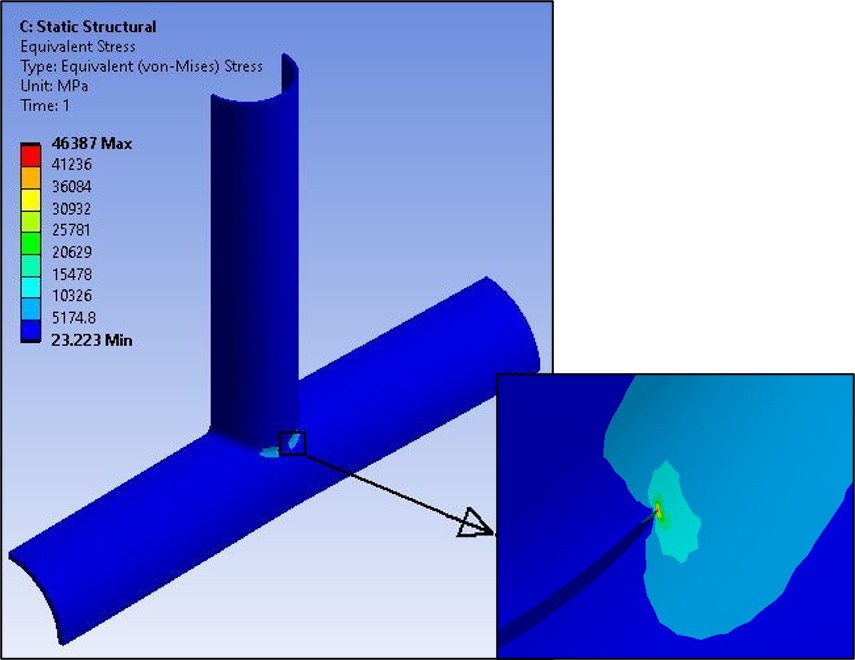
The following figures show the total deformation and equivalent stress results for the rectangular block model.
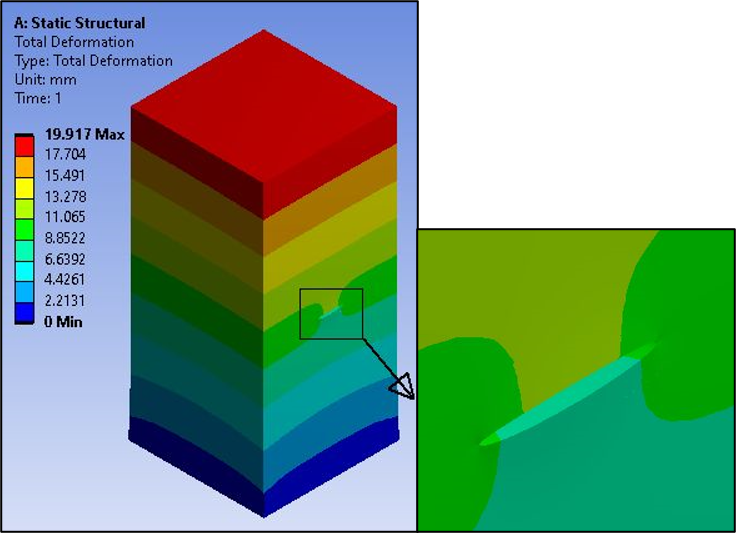
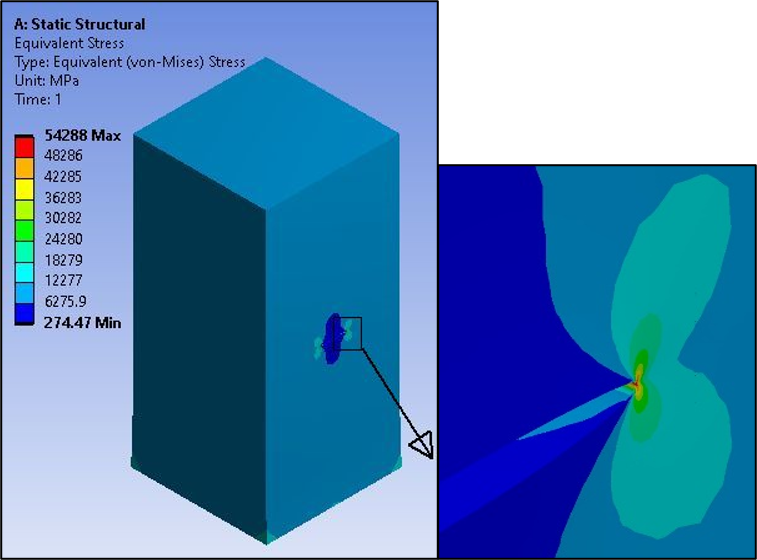
Figure 16.12: Equivalent Stress - Rectangular Block shows the maximum Von Mises stress occurring at the crack tip.
To verify the SIF (K1) accuracy obtained via the interaction integral method, the
results are compared to analytical results of Newman and Raju [1] and the finite-element results of
Kamaya [2] (see Figure 16.13: Comparing Normalized SIF (K1) Results with those Reported in the Literature -
Rectangular Block). For the comparison, results are
plotted as  , where
  is the initial radius of the flaw and
  is the normal stress. Since the crack exists at the center of the
rectangular block, the values are plotted for half of the crack. The results agree
closely with those obtained in the references.
is the normal stress. Since the crack exists at the center of the
rectangular block, the values are plotted for half of the crack. The results agree
closely with those obtained in the references.
Figure 16.13: Comparing Normalized SIF (K1) Results with those Reported in the Literature - Rectangular Block
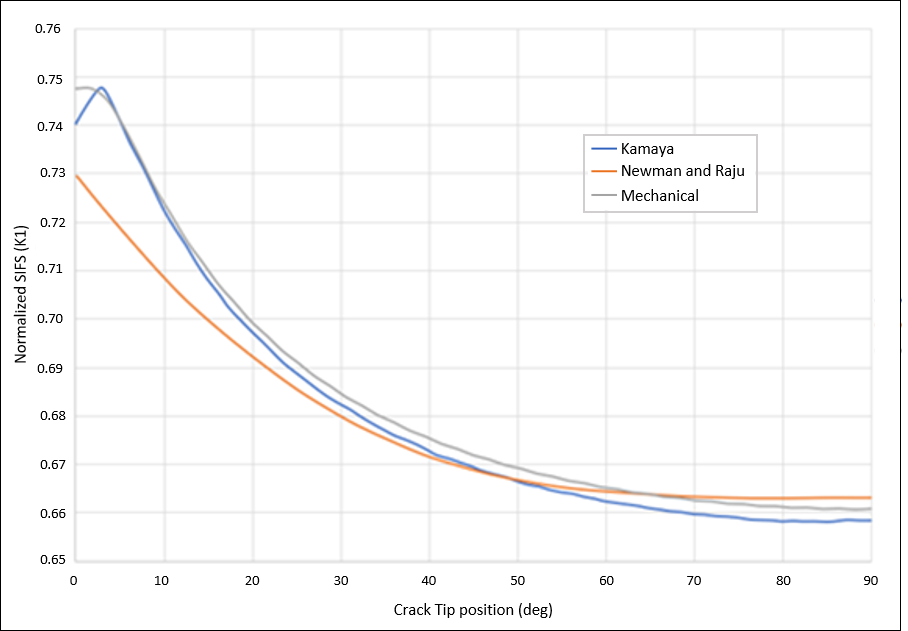
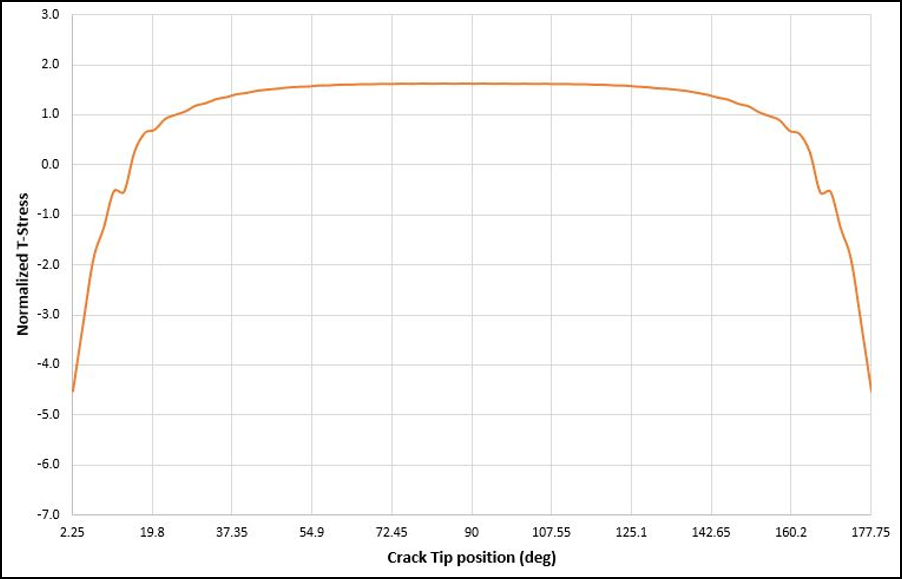
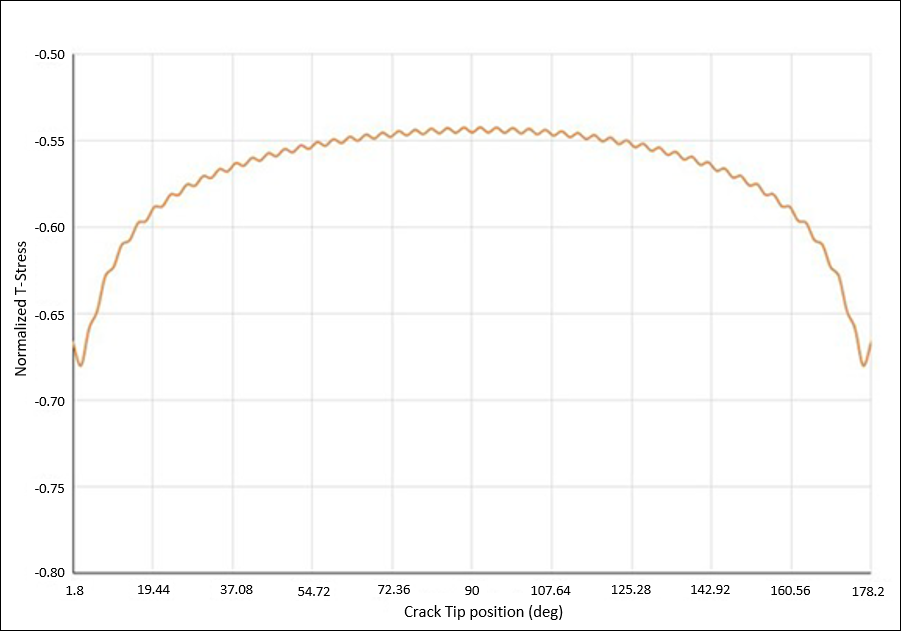
Figure 16.14: Normalized T-Stress - Rectangular Block plots the Normalized T-Stress
calculated for the semicircular surface flaw, where normalized T-Stress is
calculated as  .
.
The following figures show the Total Deformation and Equivalent Stress results for the X-joint pipe with the warped flaw at the welded joint.
The SIFs of the mixed-mode 3-D problem with the warped crack surface were compared with those of Rhee and Salama [4]. Normalized SIFs (KX) is calculated using the formula below:

where T is the thickness of the pipe and KX is K1, K2, and K3. Normalized SIFs are plotted as a function of normalized distance, which is the distance from center of the crack along the crack front divided by half of the crack tip length.
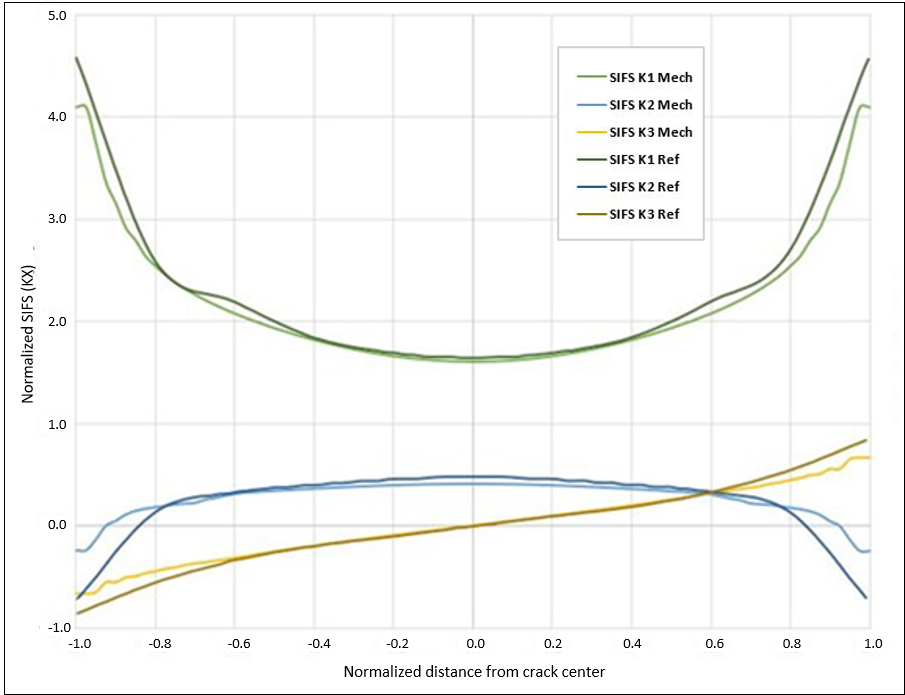
The comparison shows that the normalized SIF results agree well with the reference results, except near the end points, as illustrated above. A finer mesh at the end-point regions can improve the results.
Figure 16.18: Normalized T-Stress - X-Joint Pipe plots the T-Stress result for the X-Joint Pipe with warped flaw.