


Probe annotations add labels of result values at points where you click your solved model. You can optionally display labels for minimum and maxiumum results for the model.
Adding Probe Annotations
Use the Probe options on the Results context menu to add probe annotations to your model.
- Probe
Select this option to interactively apply a probe annotation label.
Move your mouse over the geometry to display the results at the mouse location.
Click the desired location to place an anchor for a probe annotation label at that point. The label displays the results value at the anchor point.
Limitation:Annotations are not supported for results that are scoped to edges and vertices.
Values are cleared if you re-solve your simulation.
Values for positions inside of an element may differ from hand-calculated values, especially for certain user defined result expressions. See the limitations topic in the Interpolation of Result Values section.
- Snap
When active (the default), this option automatically places anchors for probe annotation labels on the nearest mesh node to the mouse click. The probe annotation “snaps” to the node. For high order elements, this includes midside nodes as well as the centroids of element faces.
If Snap is active, the probe annotation label automatically includes the results value and the node ID or element ID at the anchor point. To remove the node ID or element ID from the label, see Displaying Node IDs/Element IDs in Probe Annotations.
Limitation: The Snap feature does not support the Geometry menu display options , , or .
- Maximum and Minimum
Select these options to add annotations for the maximum (Max label) and/or minimum (Min label) values of the selected result.
You can optionally display the results value and the node ID or element ID in the Min and Max labels. For details, see Displaying Node IDs/Element IDs and Results Values in Minimum and Maximum Annotations
Limitation: The and options consider only visible bodies. If you hide a body that includes one of these annotations, you could see a discrepancy between the minimum and maximum values displayed in the Details properties for the result versus the (new) location of the annotations.
Probe Annotations and the Graphics Annotation Window
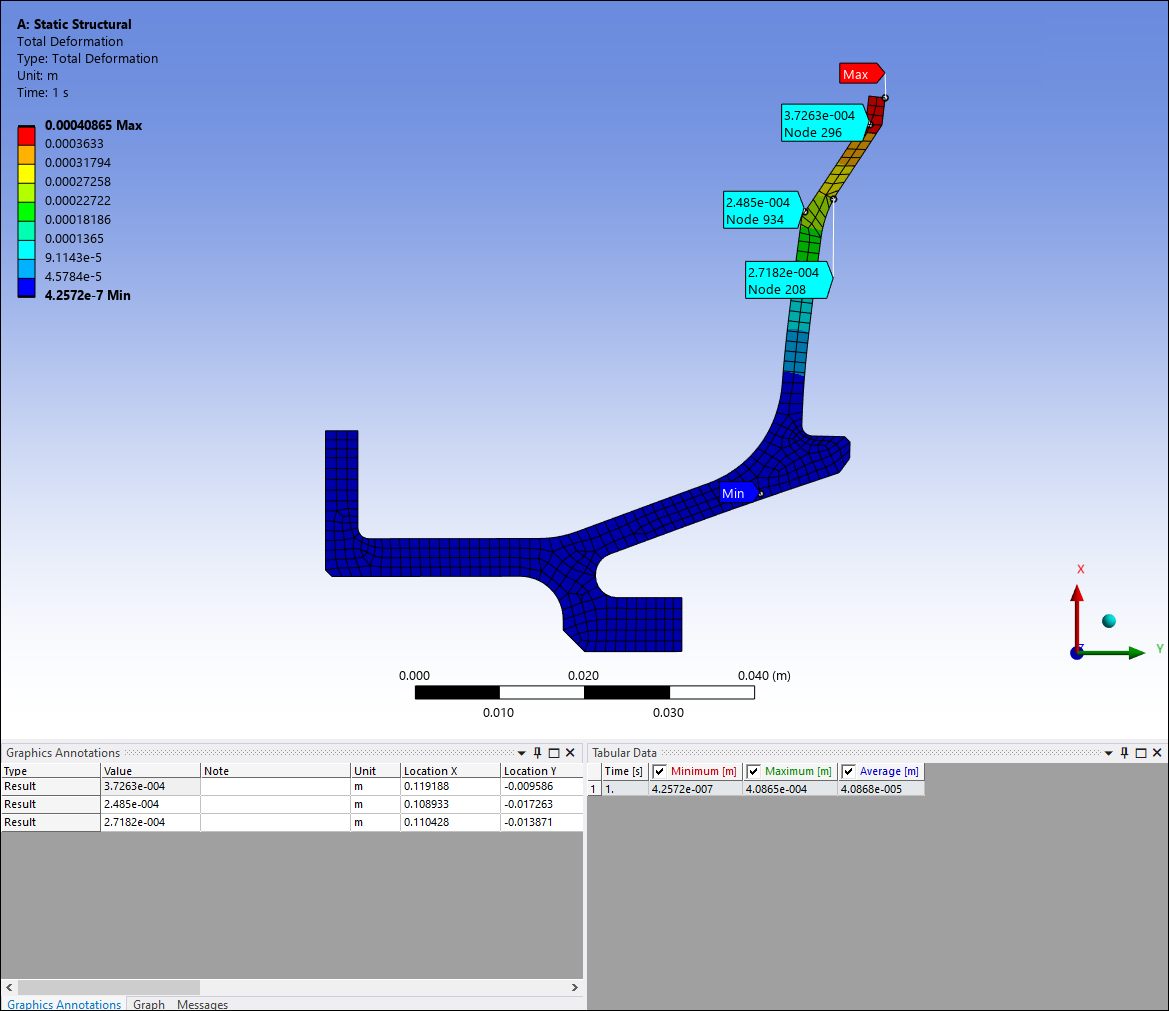
Probe annotation labels are displayed in the Graphics Annotation window, as shown in the following figure. The solution values at each anchor point are listed in the label and the Graphics Annotation table at the bottom of the window. Minimum (Min) and maximum (Max) solution values are labeled with arrows on the model and are listed in the Tabular Data pane along with the average solution value.
For detailed information about displaying probe annotations, see Probe Annotation Display Options, Tabular Data and Graph Results for Probes and Contours and Graphics Annotation Window.
Tip: The application does not automatically save newly created probe annotations. You will need to save the project manually.
You can optionally define a path between two probe annotation labels as part of your results analysis. See Defining a Path from Probe Labels for details.
Deleting Probe Annotations
To delete a probe annotation label, do the following:
Click the probe annotation label or a row in the Graphics Annotation table to select it. Hold down the Ctrl key to select multiple labels or table rows.
Press the Delete key.