The Short Time Fourier Transform (STFT) is very useful to estimate the NVH characteristics of a drivetrain system. The STFT uses the Hamming window to reduce spectral leakage. The steps at each window can be controlled by the overlap and time slice. A Color map can be displayed as result of the STFT using the following steps.
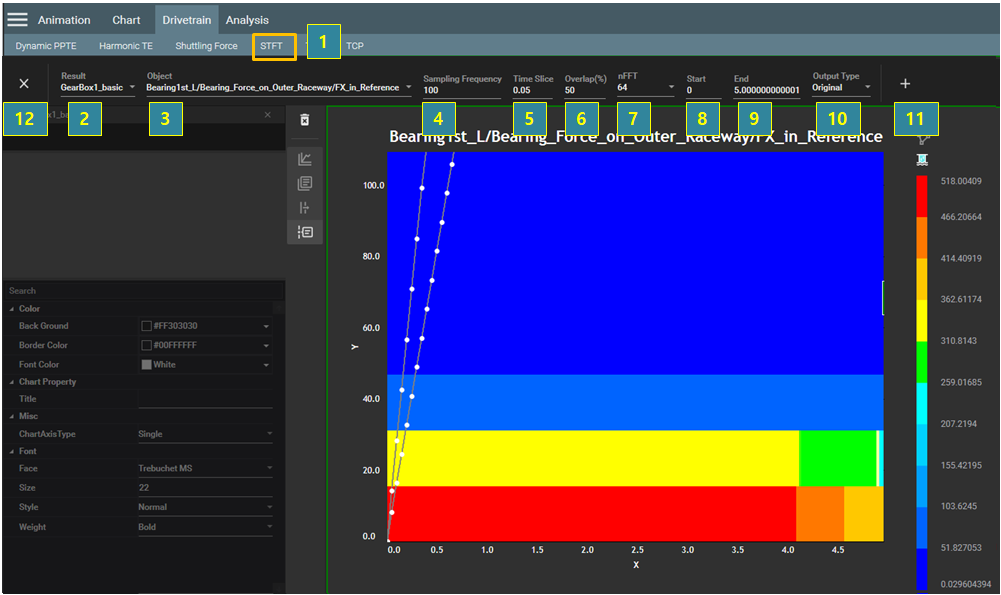
Figure 4.50: Steps for STFT
| Step | Description |
| 1 | Click in the menu bar. |
| 2 | Under Result, select the DFR filename. |
| 3 | Under Object, select the object of bearing force, bearing acceleration, or acceleration of measured points and components. |
| 4 | Set the Sampling Frequency, which is the maximum frequency of the y-axis in the color map. |
| 5 | Set the Time Slice which is the resolution of the x-axis in the color map. |
| 6 | Set the Overlap which is the percentage of duplicated time interval for performing FFT. |
| 7 | Set the number of data points (nFFT) for performing the FFT. |
| 8 | Set the Start time of the data for STFT. |
| 9 | Set the End time of the data for STFT. |
| 10 | Under Output Type, set the scale method of or . |
| 11 | Click the  button to create the graph.
 |
| 12 | Click the  button to close the operation.
 |