You can perform data filtering and smoothing of graphs in the chart view. At least one graph must be selected for the operation as in the following steps.
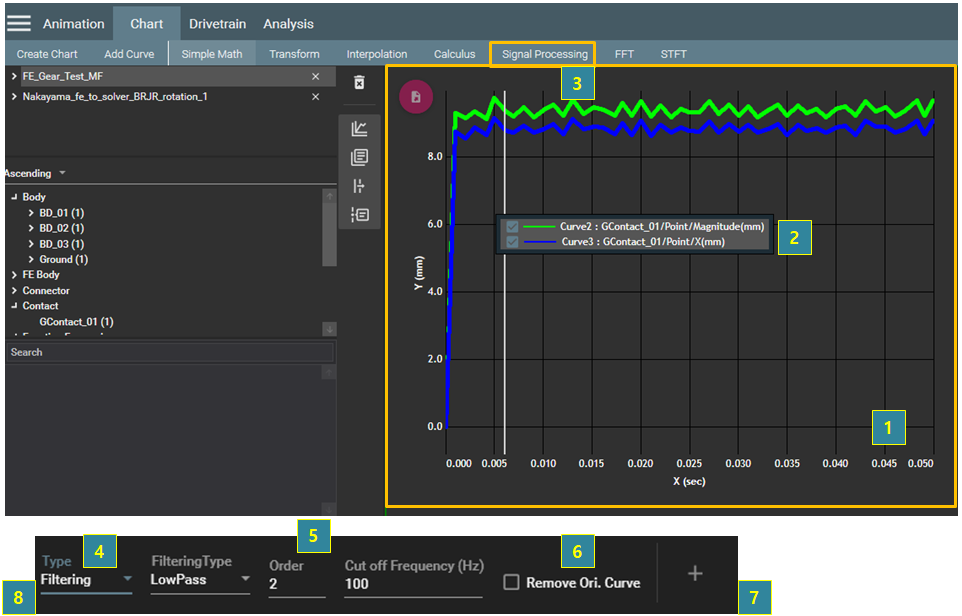
Figure 4.31: Steps for the Signal Processing operation
| Step | Description |
| 1 | Click the chart view. |
| 2 | Select the target graphs for the operation. |
| 3 | Select from the menu bar. |
| 4 |
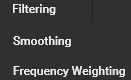
Select the Type from the following options: , , and .
|
| 5 | Set the parameters for the operation. |
| 6 | Select Remove Ori. Curve if you want to remove the target graphs. |
| 7 | Click the  button to create the graph. button to create the graph. |
| 8 | Click the  button to close the operation. button to close the operation. |
Figure 4.32: Parameters for "Signal Processing"
| Signal Processing | Parameter | Description |
| Filtering | Filtering Type |
Used to select the filter type.
|
| Order | Used to set the filter order. When the value is smaller, the resultant curve may be smoother. | |
| Cut off Frequency | Used to set the cut-off frequency. | |
| Low Cut off Frequency | Used to set the lower cut-off frequency. | |
| High Cut off Frequency | Used to set the upper cut-off frequency. | |
| Smoothing | Smoothing Method |
Used to select the smoothing type.
|
| Points of Window | Used to set the half-number of points for the moving window. As this value increases, the degree of smoothing increases. | |
| Polynomial Order | Used to set the polynomial order for the method. The larger the value, the more the peak will be preserved. | |
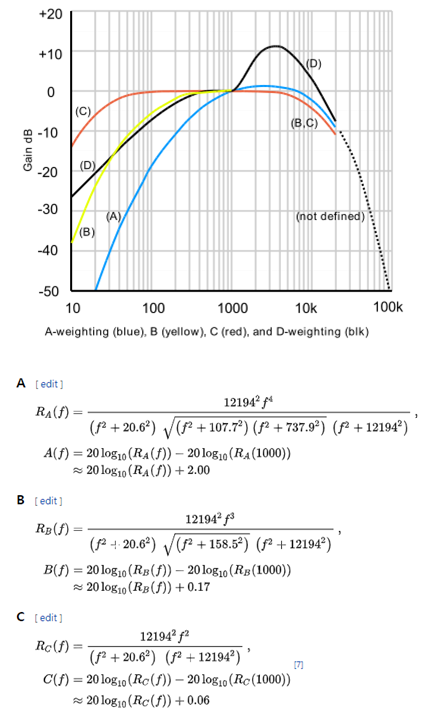
| Frequency Weighting | Weighting Type |
Used to select the weighting type.
|
| Frequency Axis | Used to set the base of the log scale. |