


You can transform data in the time domain to the frequency domain by using the Fast Fourier Transformation method (FFT) in the chart view. At least one graph must be selected for the operations as in the following steps.
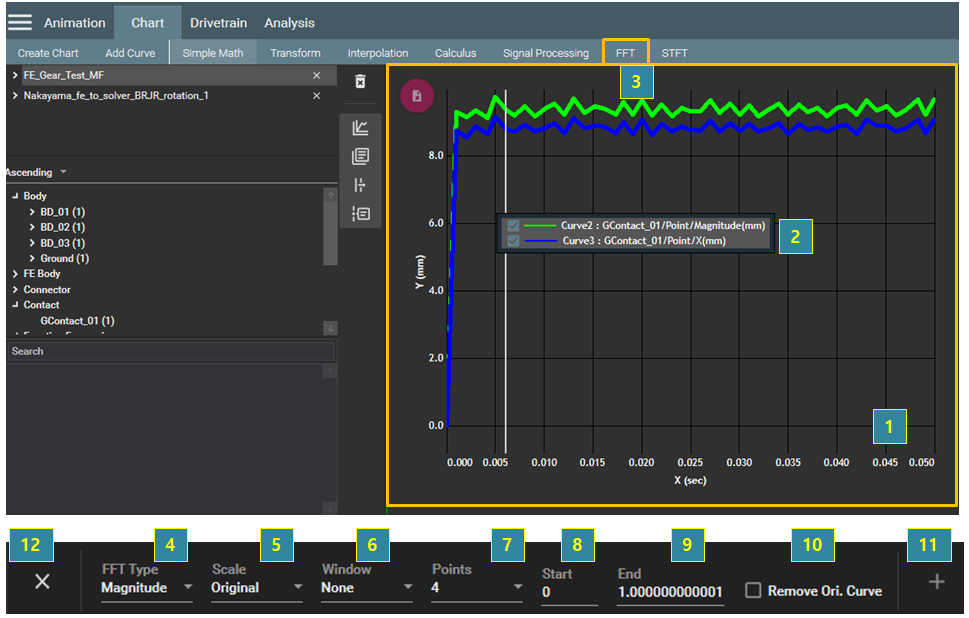
Figure 4.35: Steps for the FFT operation
| Step | Description |
| 1 | Select the chart view. |
| 2 | Select the target graphs for the operation. |
| 3 | Select from the menu bar. |
| 4 | Select either or . |
| 5 |
Select the Scale method. The resultant magnitude or phase will be scaled in the frequency domain. |
| 6 |
Select the Window method.
|
| 7 | Set the number of data for FFT. |
| 8 | Set the start time of data for FFT |
| 9 | Set the end time of data for FFT |
| 10 | Select Remove Ori. Curve if you want to remove the target graphs. |
| 11 | Click the  button to create the graph. button to create the graph. |
| 12 | Click the  button to close the operation. button to close the operation. |


