Legend properties is activated by clicking a legend background in the view as shown in the figure under Figure 4.5: Access to Chart View Properties. Various properties are supported to change the legend such as color, font, and style as shown in the figure and table below.
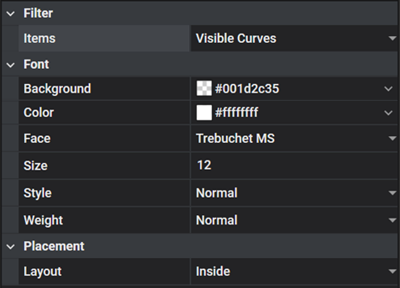
Figure 4.11: Legend Property Details
| Category | Content | Description |
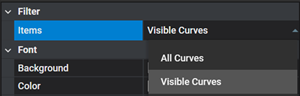
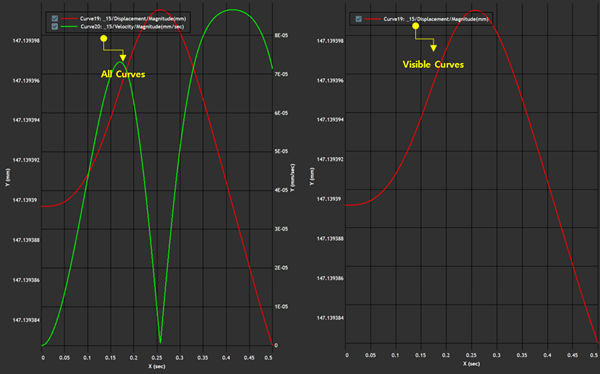
| Filter | Items | Used to filter the curves in the legend.
If is selected, this
panel sets the visibility options for the curves that you wish
to see. When is
selected, the legend and the chart view will show only the
curves that are visible.
|
| Font | Background | Used to set the background color of the legend |
| Color | Used to set the color of the curve title in the legend | |
| Face | Used to set the font of the curve title in the legend | |
| Size | Used to set the size of the curve title in the legend | |
| Style | Used to define the font style of the curve title. , , and are available. | |
| Weight | Used to define the font thickness of the chart view title | |
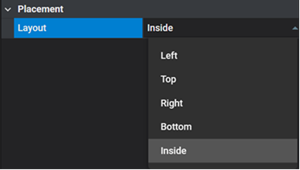
| Placement | Layout | Used to set the layout of the legend in chart view. This option allows you to place the legend wherever you want. If the legend obscures the curves display, you can move the legend out of the chart area to avoid interference. The following options are available:
 |