


The properties of x and y axes are activated by clicking near the axis in the view as shown in the figure under Figure 4.5: Access to Chart View Properties. Various properties are supported to change the axes such as label, font, and grid line as shown in the figure and table below.
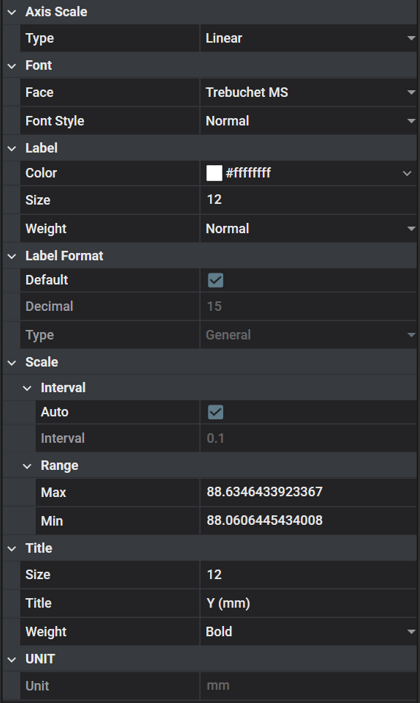
Figure 4.13: Axis Property Details
| Category | Content | Description |
| Axis Scale | Type | Used to set the axis type. , , and are available. |
| Label | Color | Used to set the color of the axis title and number. |
| Size | Used to set the font size of the axis title and number. | |
| Weight | Used to set the font thickness of the axis title and number. | |
| Label Format | Default | Used to set the number of decimal places. |
| Decimal | Used to set how to display the numbers. When the Default option is cleared, the Decimal value is automatically defined, and the number is displayed in general notation. | |
| Type | Used to define how numbers are displayed. , or can be selected, and they correspond to general notation, normal notation and scientific notation, respectively. | |
| Font | Face | Used to set the font of axis title |
| Style | Used to define the font style of axis title. , , and are available. | |
| Grid Line | Color | Used to set the grid color. |
| Style | Used to define the grid style. , , , , and styles are available. | |
| Width | Used to set the thickness of the grid line. | |
| Scale | Interval: Auto | When this option is selected, the interval is calculated automatically. If this option is cleared, the Interval is preserved even if you zoom in or out of the chart. However, if you zoom in to enlarge an area smaller than the Interval value, the Interval value will not be preserved. |
| Interval: Interval | Used to show or set the interval between divisions of the axis and grid in the chart view. | |
| Range: Max | Used to show or set the maximum value of the axis. This maximum value will be updated as you zoom in and out of the chart view. | |
| Range: Min | Used to show or set the minimum value of the axis. This minimum value will be updated as you zoom in and out of the chart view. | |
| Title | Title | Used to define the title of the axis. |
| Size | Used to set the size of the axis title. | |
| Weight | Used to set the thickness of the axis title. | |
| UNIT | Unit | Used to show the unit system of the data. |