The property panel for the graph is activated by clicking a curve in the view as shown in the figure under Figure 4.5: Access to Chart View Properties. Various properties are supported to change the curve such as color, source, and line style, as shown in the figure and table below.
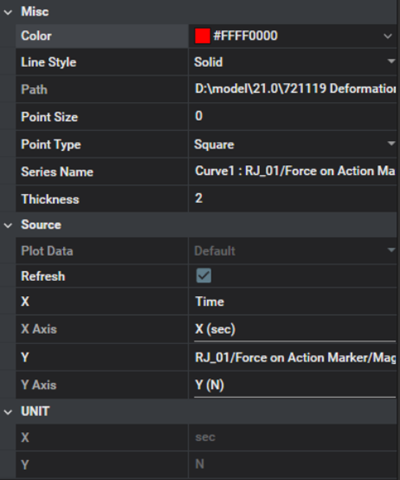
Figure 4.9: Graph Property Details
| Category | Content | Description |
| Misc | Color | Used to set the line color for the graph. |
| Line Style | Used to set the line style for the graph. You can select one of , , , , and . | |
| Path | Used to show the path of the data source for the graph. | |
| Point Size | Used to define the point size. When the value is 0, the point is not displayed on the graph. | |
| Point Type | Used to define the point type. You can select one of , , and . | |
| Series Name | Used to define the curve name in the legend. | |
| Type | Used to set the graph type. You can select one of , , , , and . | |
| Thickness | Used to set the curve thickness. | |
| Source | Plot Data | Used to show the data source for the graph. Default means that the data is from a DFR file. |
| Refresh | Used to update data by refreshing results. | |
| X | Used to show the data source for the x-axis. | |
| X Axis |
Used to set the X-axis. You can assign an existing axis using Move To or create a new one. This option is available when XUnit Split is selected in chart properties.
| |
| Y | Used to show the data source for the y-axis. | |
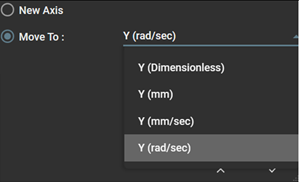
| Y Axis |
Used to set the Y-axis. You can assign an existing axis using Move To or create a new one. This option is available when YUnit Split is selected in chart properties.
| |
| UNIT | X | Used to show the unit system of the x-axis data. If no unit system is specified or if the post-processor cannot determine it, Dimensionless will be displayed. |
| Y | Used to show the unit system of the y-axis data. If no unit system is specified or if the post-processor cannot determine it, Dimensionless will be displayed. |