The property panel for chart view is activated by clicking the background in the view as shown in the figure below.
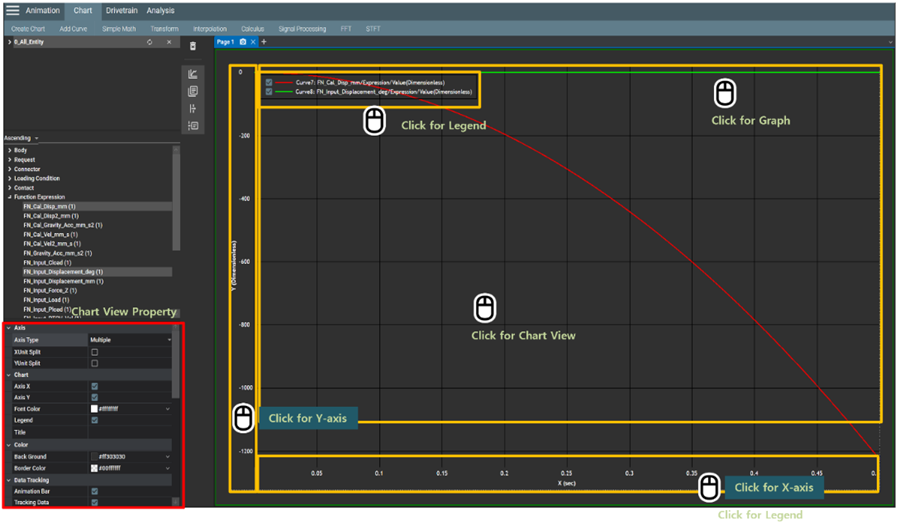
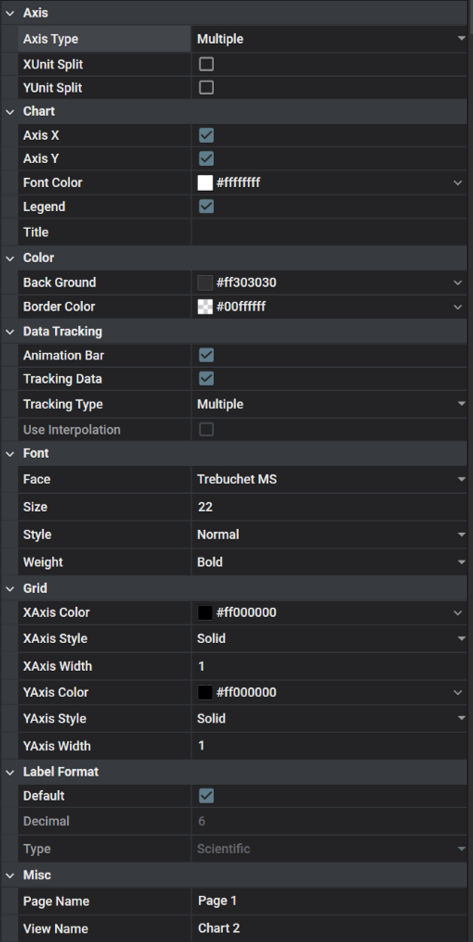
Various properties are supported to change the chart view such as color, visibility, and font as shown in the figure and table below.
Figure 4.6: Chart Property Details
| Category | Content | Description |
| Axis Property | Axis Type | Used to set the axis type by choosing between and . |
| XUnit Split | Used to display multiple X axes when there is more than one graph in the chart view. This option is available when the Axis Type is . | |
| YUnit Split | Used to display multiple Y axes when there is more than one graph in the chart view. This option is available when the Axis Type is . | |
| Chart Property | Axis X | Used to show the X-axis. See Configuration of Chart View for more information. |
| Axis Y | Used to show the Y-axis. See Configuration of Chart View' for more information. | |
| Legend | Used to show the legend. See Configuration of Chart View for more information. | |
| Title | Used to define the title of chart view. See Configuration of Chart View for more information. | |
| Color | Back Ground | Used to set the background color of the chart view. |
| Boder Color |
Used to set the border color of the chart view.
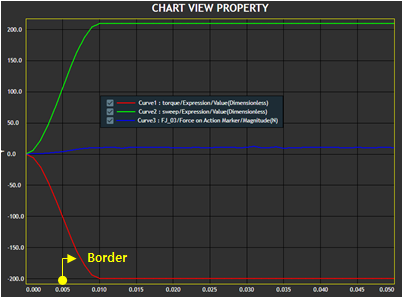
| |
| Font Color | Used to set the font color of the chart view title. | |
| Data Tracking | Animation Bar | Used to show the animation bar. See Configuration of Chart View for more information. |
| Tracking Data | Used to show the tracking curve. See Configuration of Chart View for more information. | |
| Tracking Type |
: Used to show labels on data points of all curves where the mouse cursor intersects the vertical line of the location (see below). : Used to show the label on the point or data point of the curve closest to the mouse cursor.
| |
| Use Interpolation | This only works when the Tracking Type is set to . If Use Interpolation is , it finds the data point closest to the mouse cursor and displays the label on it. If Use Interpolation is , it finds the point as well as the data point on the curve closest to the mouse cursor and displays the label. | |
| Font | Face | Used to select the font of the chart view title. |
| Size | Used to define the size of the chart view title. | |
| Style | Used to define the style of the chart view title. , , and are available. | |
| Weight | Used to define the font thickness of the chart view title. | |
| Label Format | Default | Used to set the number of decimal places. |
| Decimal | Used to set how to display the numbers. When the Default option is cleared, the Decimal value is automatically defined, and the number is displayed in scientific notation. | |
| Type | Used to define how numbers are displayed. , or can be selected, and they correspond to general notation, normal notation and scientific notation, respectively. | |
| Misc | Page Name | Used to set the name of the page. |
| View Name | Used to set the name of the view. |