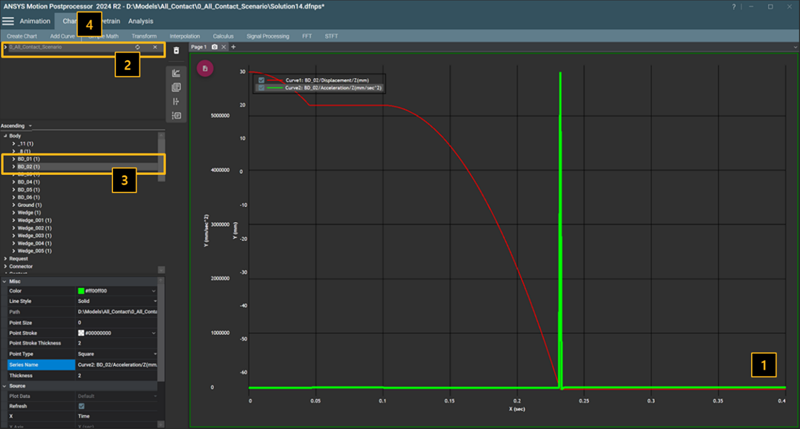
A graph can be added to the activated chart view using the following steps.
Figure 4.14: Steps for adding a graph
| Step | Description |
| 1 | Select the chart view in the window. |
| 2 | Select a DFR file in the database navigator. |
| 3 | Select required Objects in the object navigator. |
| 4 | Select from the menu. |
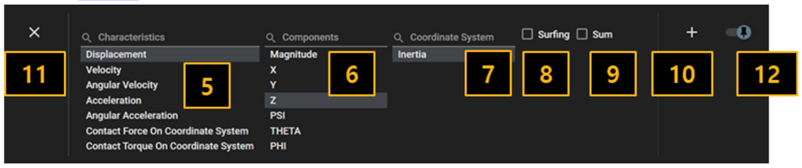
| 5 | Select the Characteristics which are dependent on the selected object. |
| 6 | Select the which are dependent on the selected Characteristics. |
| 7 | Select the Coordinate System. The coordinate system is used as the reference frame to measure a vector. The inertia reference frame is the default and the pre-defined coordinate system is available in this step. Depending on the type of Characteristics selected, you can check whether the coordinate system can be converted through the UI status. See Figure 3.94: Coordinate System in Chart Drawing for more information. |
| 8 | The Surfing function controls the reloading of curves as the selection of objects, characteristics and components changes after clearing the active chart view. |
| 9 | The Sum function adds the values of the selected targets together into a single curve. |
| 10 | The button  is used to add a curve to the chart
view. is used to add a curve to the chart
view. |
| 11 | The button
 is used to close the panel.
 |
| 12 | The button
 is used to fix
the size of the panel set by the user. is used to fix
the size of the panel set by the user. |